CRWD is the most extended below its 200-day average since Aug 2026
CRWD's % from 200-day avg is at -43% — far below its 200-day average, in the top 3.2% of its 10-year range. The last 6 times CRWD reached this extreme, the median move over the next 15 trading days was +4.1% (50% finished higher).
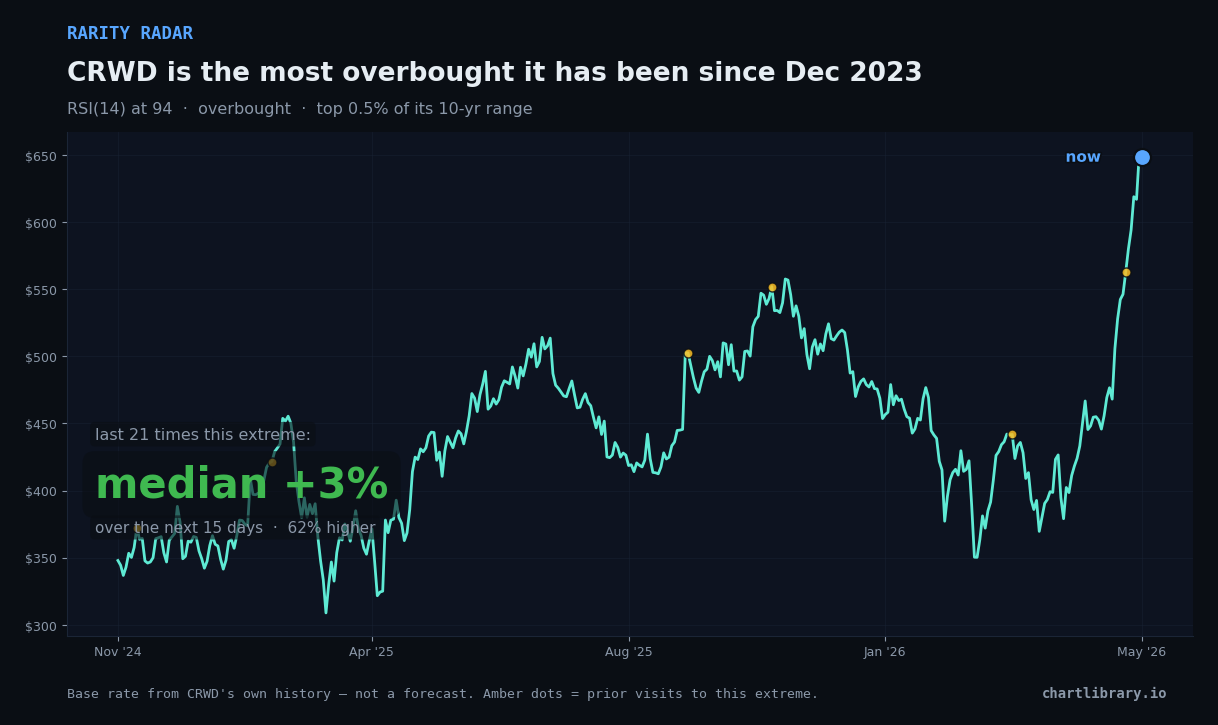
This is a base rate from CRWD's own history — what happened after prior visits to this extreme — not a prediction. 6 prior cases is a guide, not a guarantee. Extremes can persist far longer than they "should."
How Rarity Radar works
We measure CRWD on several conditions (distance from its 200-day average, RSI, recent momentum) against its own 10-year history, then surface the single most extreme one and the empirical forward returns that followed prior visits to that extreme.
See CRWD's full cohort of historical analogs and calibrated outcome distribution:
CRWD cohort →Open in Chart Library