META today looks like RHP did in Jan 2026
META's chart over the last 30 trading days is a 76% shape match for RHP in Jan 2026 — its closest historical analog across a decade of market data. In the 15 trading days after that point, RHP went +9%.
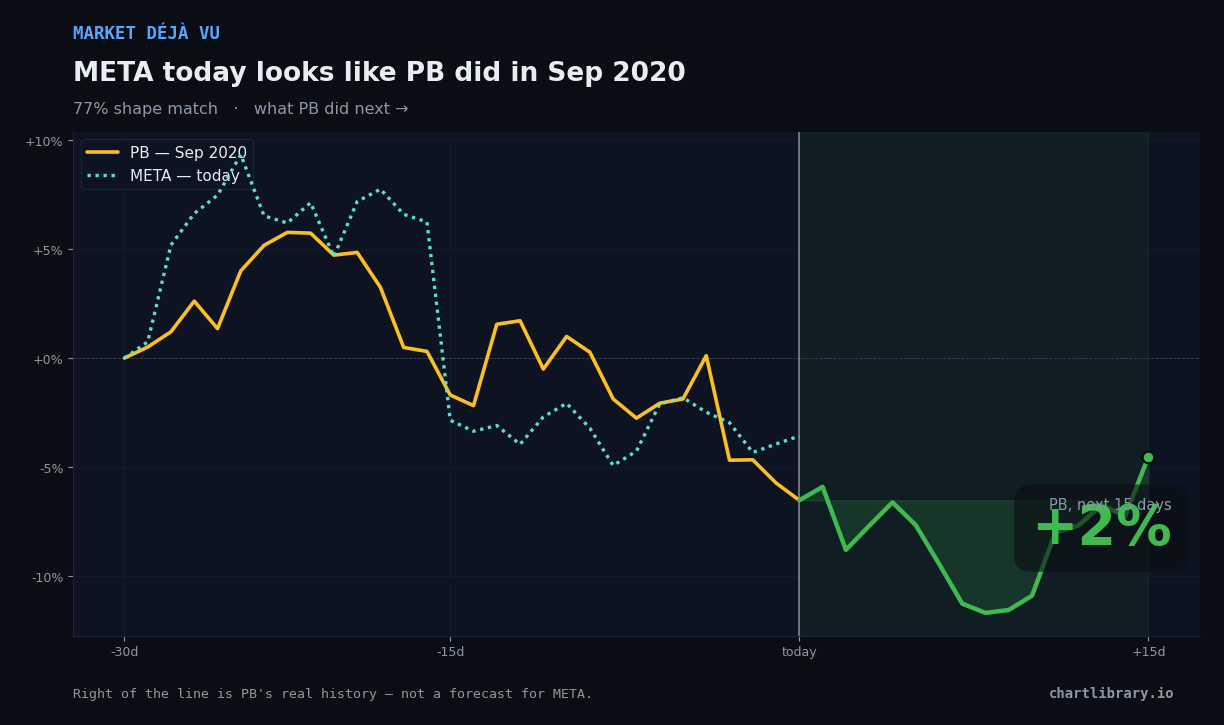
The forward path is RHP's actual history after that date — not a prediction for META. A close shape match is a starting point for research, not a signal. Different stocks with similar charts can do very different things next.
How we find the twin
We embed META's recent daily chart into a 256-dimension shape vector and search millions of historical chart windows for the nearest match by shape, then re-score the finalists on the exact window shown so the lines actually overlap. The match is amplitude-aware, so it's a real twin — not just "both went up."
See META's full cohort of historical analogs — the distribution of what they all did next, with calibrated confidence:
META cohort →Open in Chart Library