Chart Library
The three most talked-about stocks gapping this morning, and the ten most similar charts from the past for each.
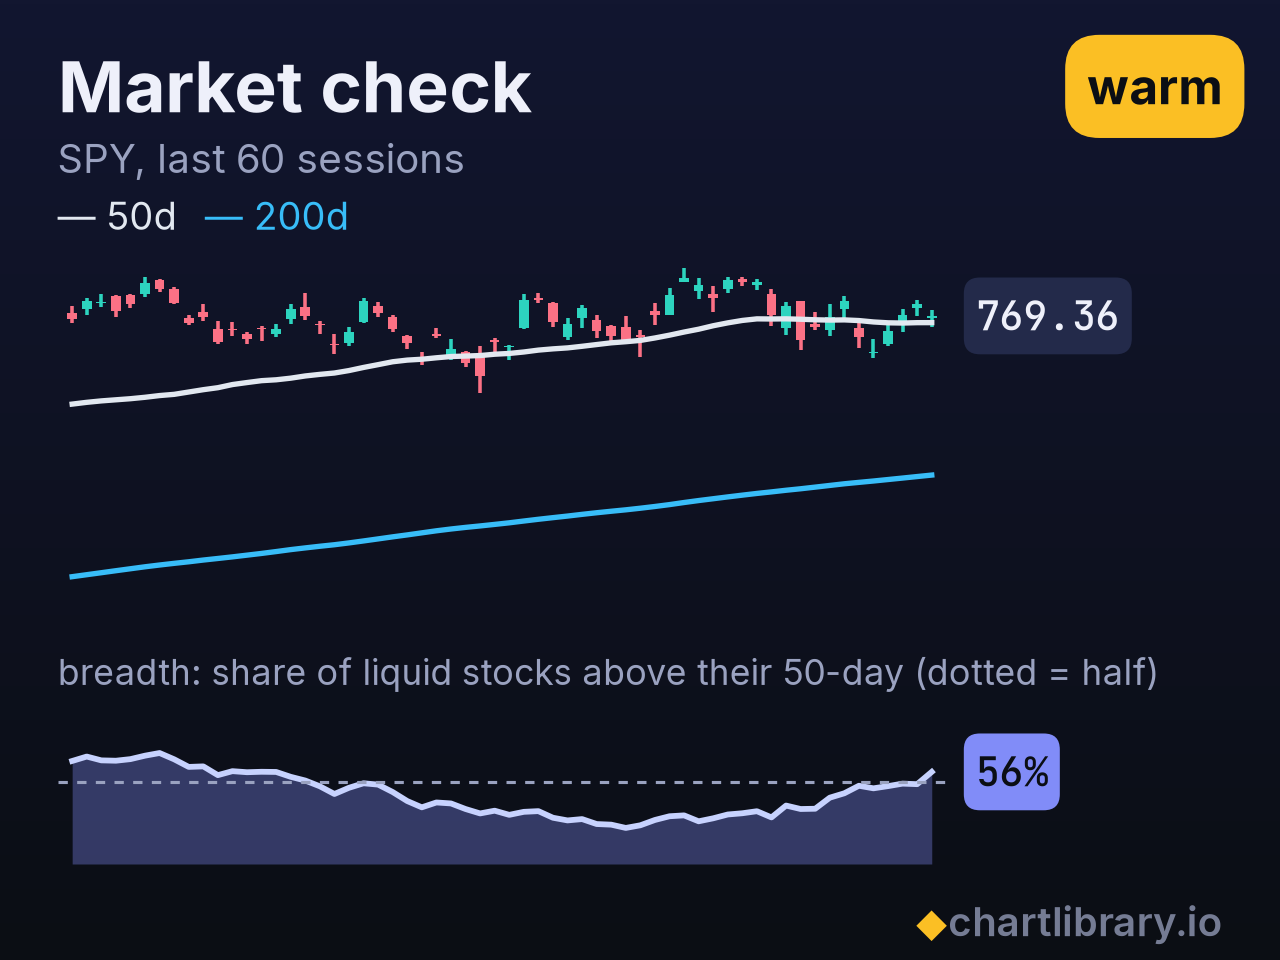
Market: warm. For: SPY is above its 50-day average, SPY is above its 200-day average, new highs are outnumbering new lows; against: SPY is gapping down before the open.
1. INTC −25.3%earnings + guidance
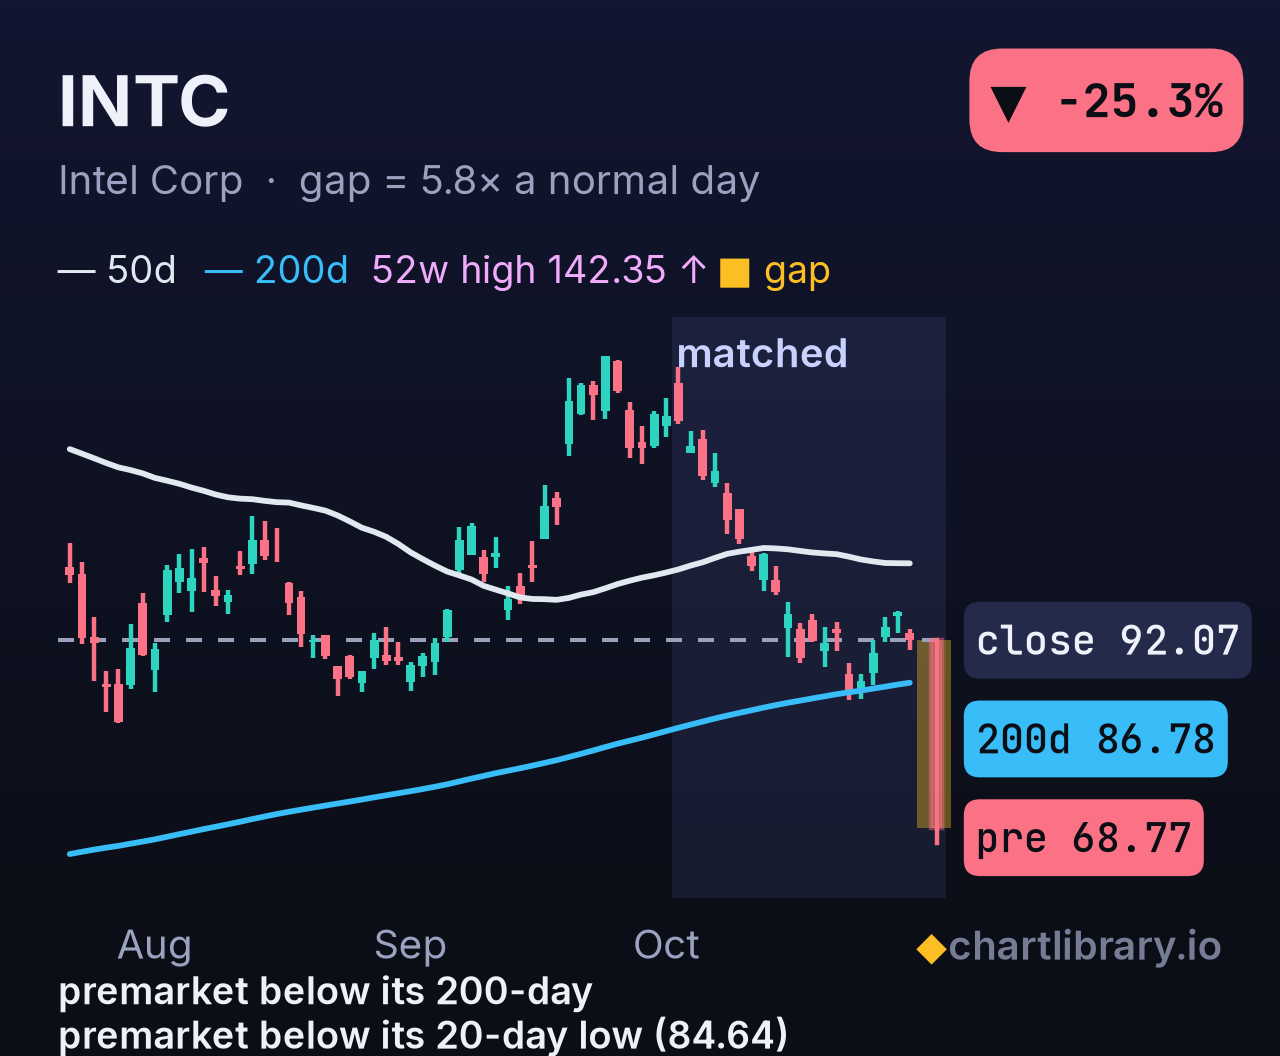
- Where it came from: Was down 23% in the last month, 35% under its 52-week high; today's gap takes it back under its 200-day average.
- Today: Q3 adj. EPS $0.52 vs $0.40 est, revenue $16.513B vs $16.467B; Q4 adj. EPS guide $0.25 vs $0.43 est and sales $15.000B-$16.000B vs $17.045B, with the Israel fab explosion cutting the Q4 outlook by about $300M.
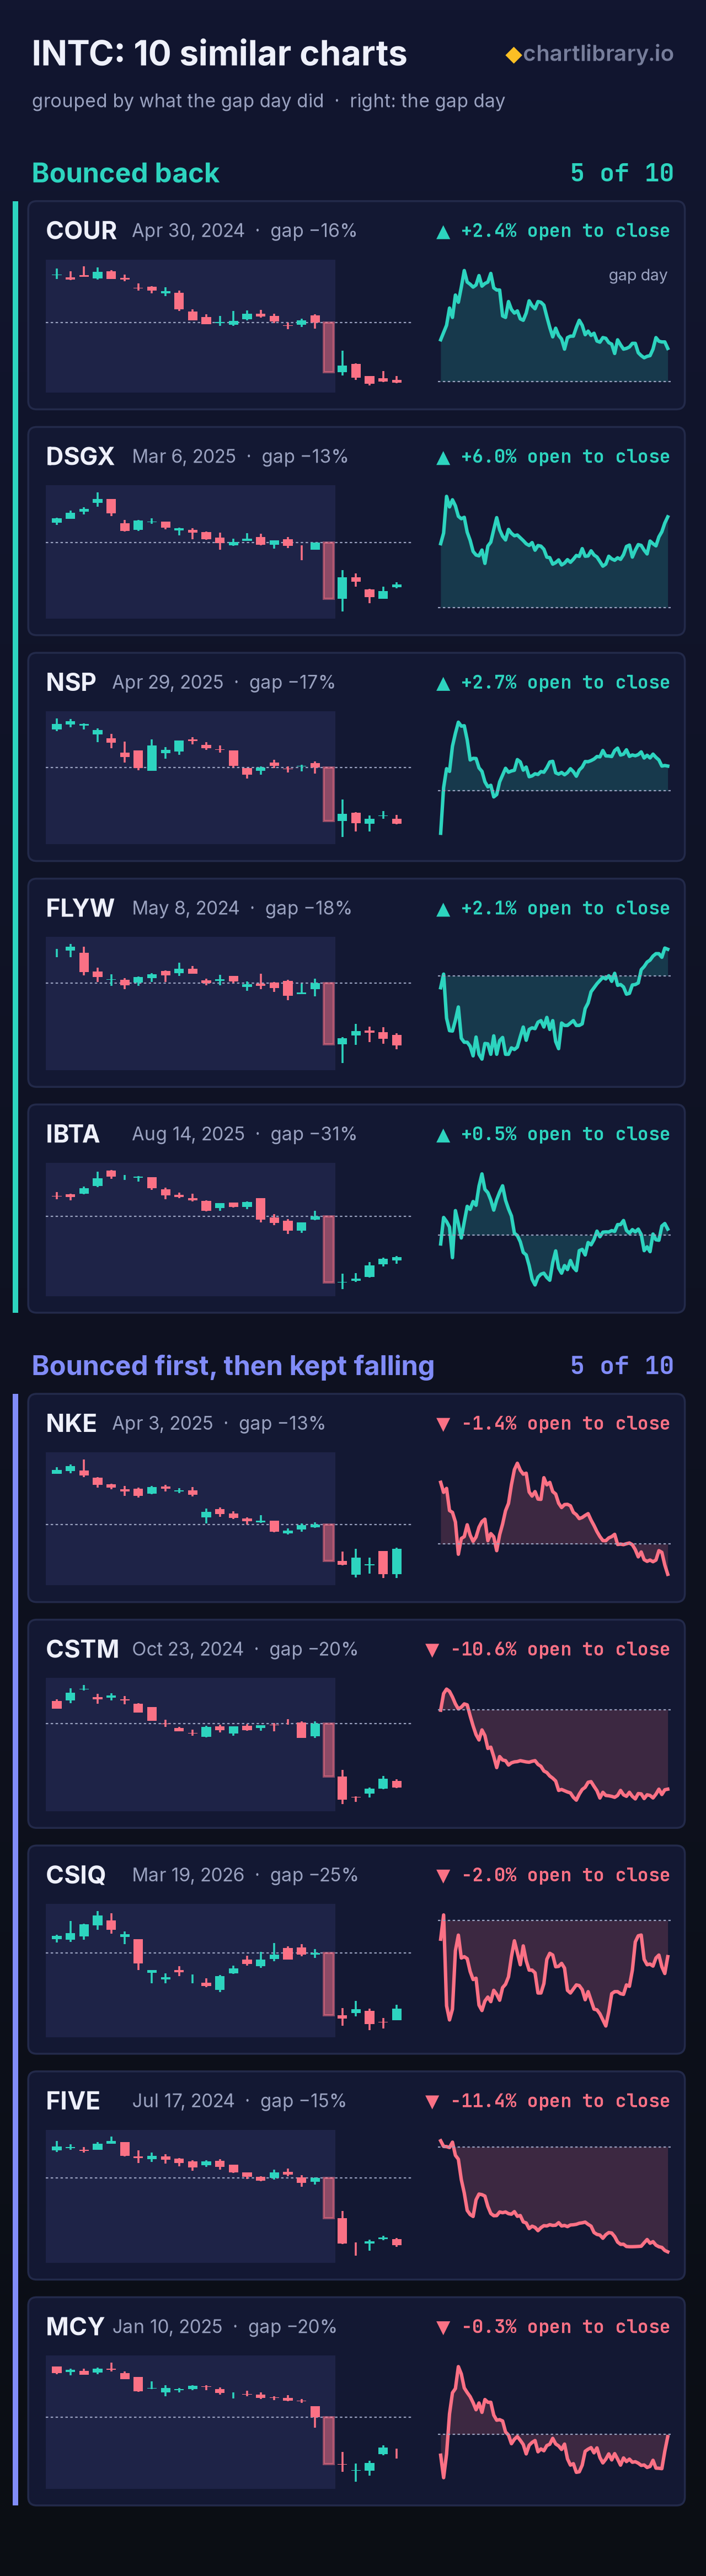
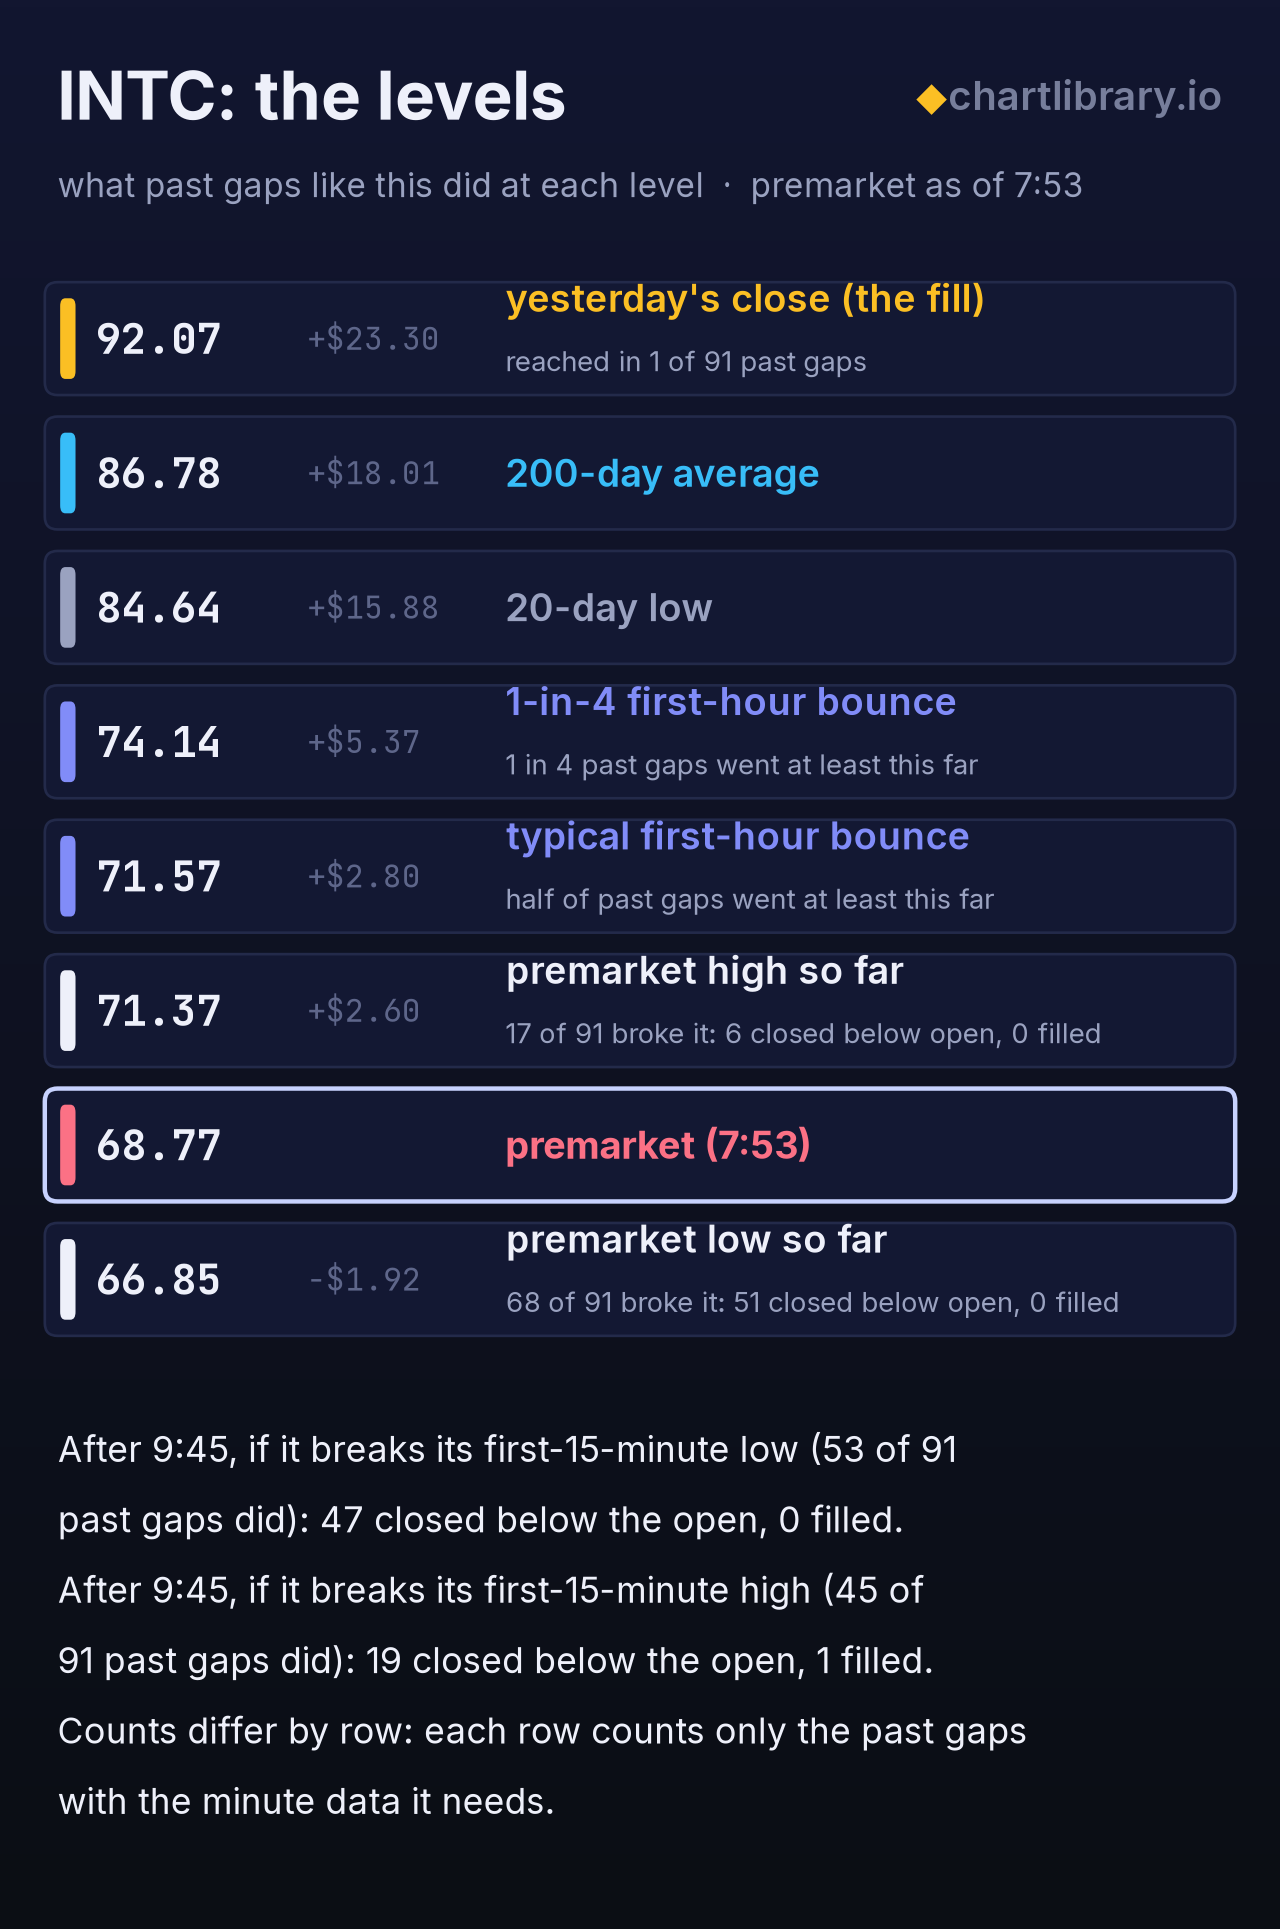
- Past gaps like this: Of the 10 most similar charts: 5 bounced back; 5 bounced first, then kept falling. Across all 91 similar gaps, almost never filled the gap the same day.
The full research on INTC: the company, its last eight quarters, how it traded on its reports →
2. RDDT -20.9%earnings + guidance
Subscribers see all three: the chart, three bullets, the 10 most similar charts and the levels, plus the full detail on each.
3. AMZN -6.8%earnings + guidance
Subscribers see all three: the chart, three bullets, the 10 most similar charts and the levels, plus the full detail on each.
This is the free name from the October 30 morning issue. The issue lands in subscribers' inboxes every weekday at about 8:10 ET.