← The October 30 morning issue
Intel Corp (INTC)
1. INTC −25.3%earnings + guidance
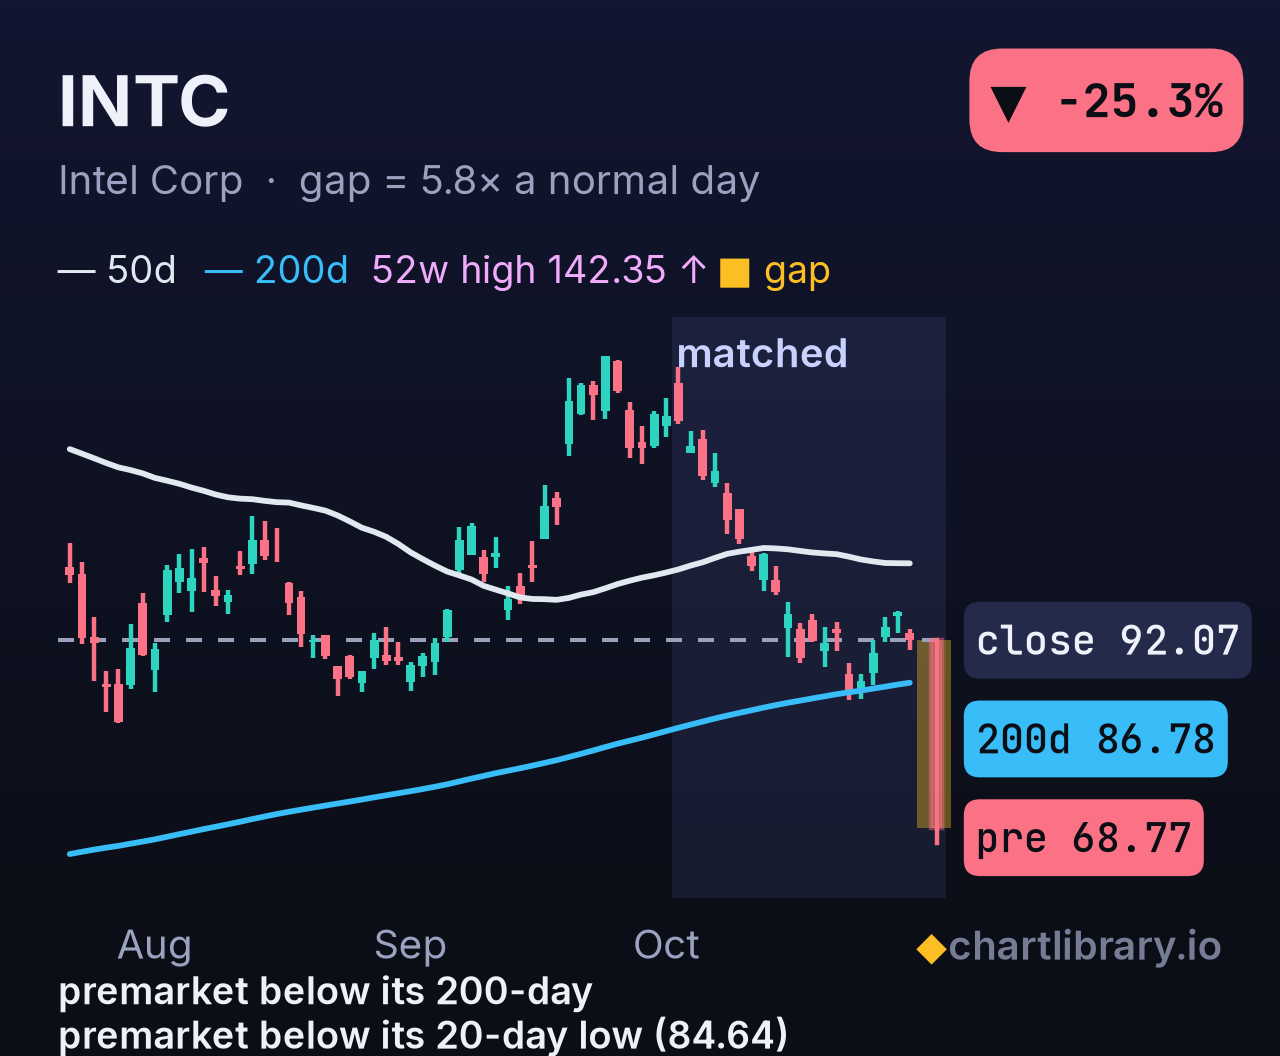
- Where it came from: Was down 23% in the last month, 35% under its 52-week high; today's gap takes it back under its 200-day average.
- Today: Q3 adj. EPS $0.52 vs $0.40 est, revenue $16.513B vs $16.467B; Q4 adj. EPS guide $0.25 vs $0.43 est and sales $15.000B-$16.000B vs $17.045B, with the Israel fab explosion cutting the Q4 outlook by about $300M.
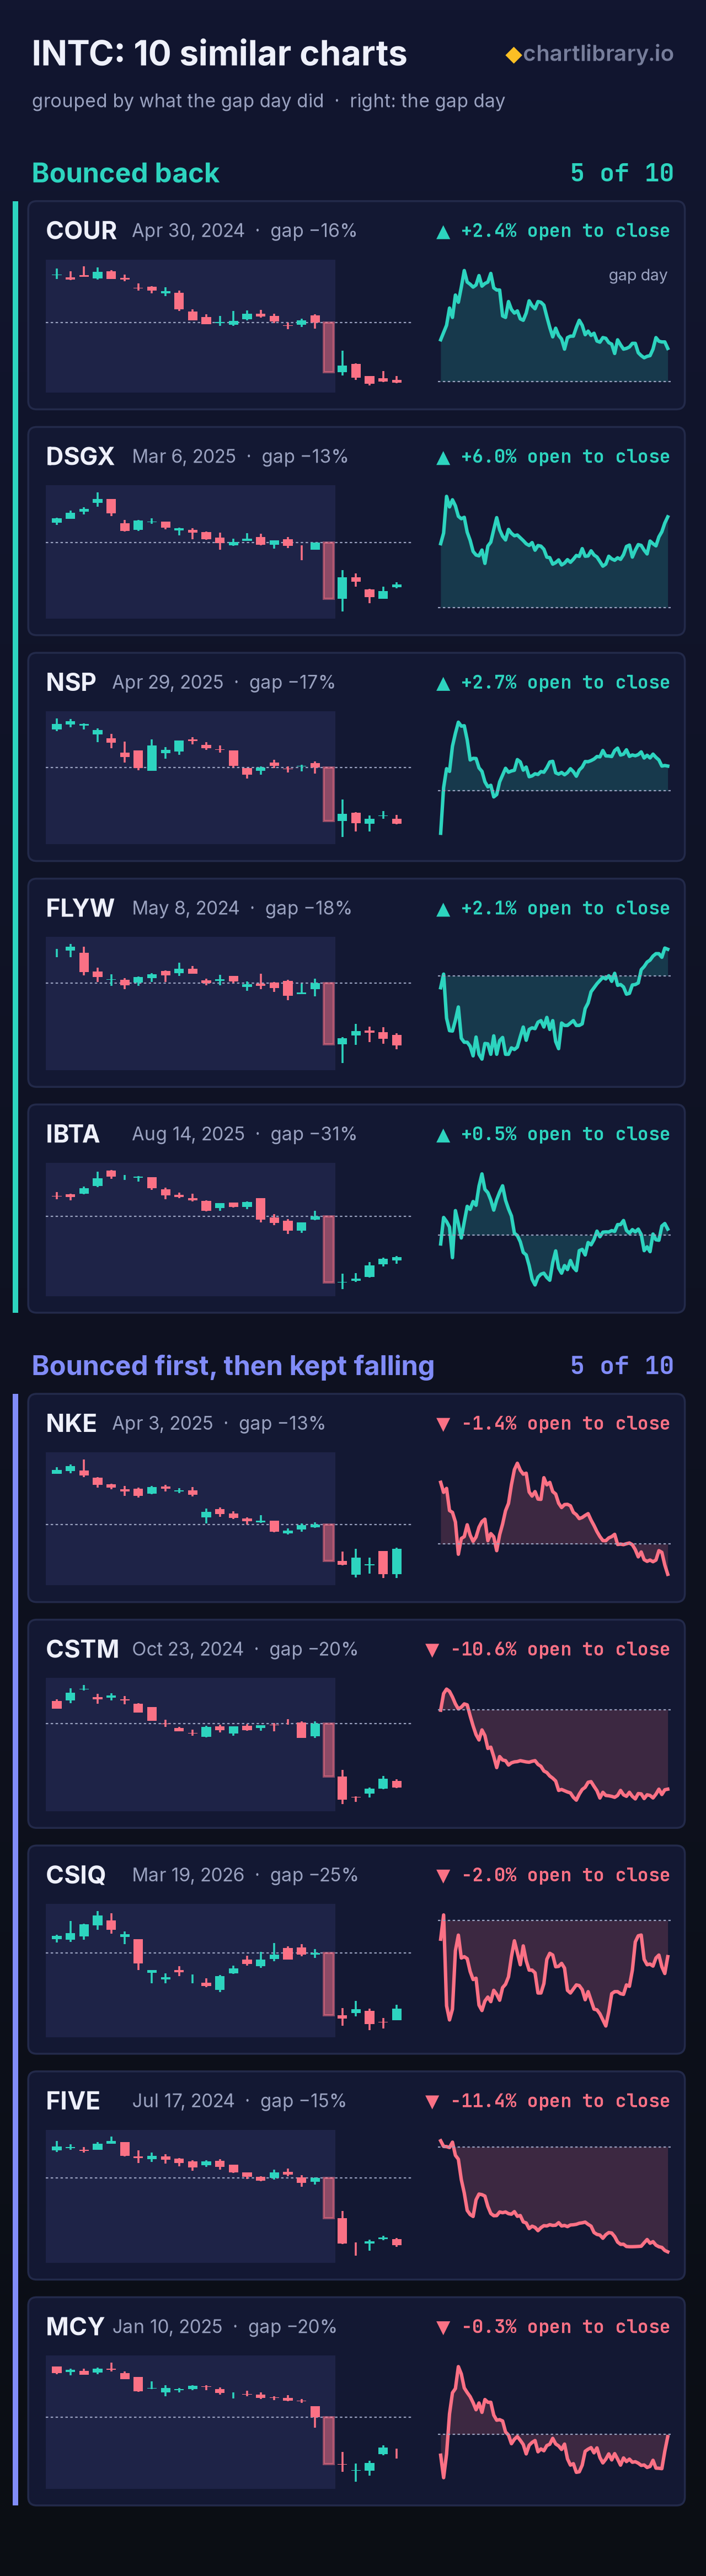
- Past gaps like this: Of the 10 most similar charts: 5 bounced back; 5 bounced first, then kept falling. Across all 91 similar gaps, almost never filled the gap the same day.
What's new today
The new report is fiscal Q3 2026, later than the Q2 2026 quarter in the recent run of results. Adjusted EPS was $0.52 versus a $0.40 estimate and revenue was $16.513 billion versus $16.467 billion, a small beat and a step above Q2 2026 revenue of $16.128 billion. The December-quarter outlook broke with that acceleration: adjusted EPS of $0.25 versus a $0.43 estimate, GAAP EPS of $0.10 versus $0.15, and sales of $15.000 billion to $16.000 billion versus a $17.045 billion estimate. CFO David Zinsner tied about $300 million of that Q4 revenue cut and about 200 basis points of gross margin to an explosion at the Kiryat Gat fab, which did not operate for two weeks, and said a similar Q1 revenue hit was still being assessed. Management also flagged a faster PC correction, with 2026 PC unit TAM down about 12% and second-half units down more than 20%, even as Data Center & AI revenue was $7.3 billion, up 78%, and Foundry revenue was $6.7 billion, up 58%.
The company
Intel designs and manufactures microprocessors and is the market-share leader in central processing units for personal computers and servers. It sells those chips through Intel Products and is rebuilding manufacturing under Intel Foundry, including process technology it has discussed with outside customers. It makes money from chip sales and foundry work. Trailing-twelve-month revenue was $56.217 billion.
The last eight quarters
From Q3 2024 through Q4 2025, quarterly revenue stayed between $12.667 billion and $14.260 billion, and year-over-year growth ranged from -7.4% to +2.8%. Growth then picked up: revenue rose 7.2% to $13.577 billion in Q1 2026 and 25.4% to $16.128 billion in Q2 2026. Gross margin recovered from 15.0% in Q3 2024 to 40.4% in Q2 2026, while operating margin was positive in four of the eight quarters and reached 11.1% in Q2 2026 after -23.1% in Q1 2026. Diluted EPS was negative in seven quarters, including -$2.16 in Q2 2026; operating cash flow was positive in every quarter and was $7.006 billion in Q2 2026. Trailing results were still a loss, with an operating margin of -6.8%, a net margin of -24.7%, and diluted EPS of -$2.66.
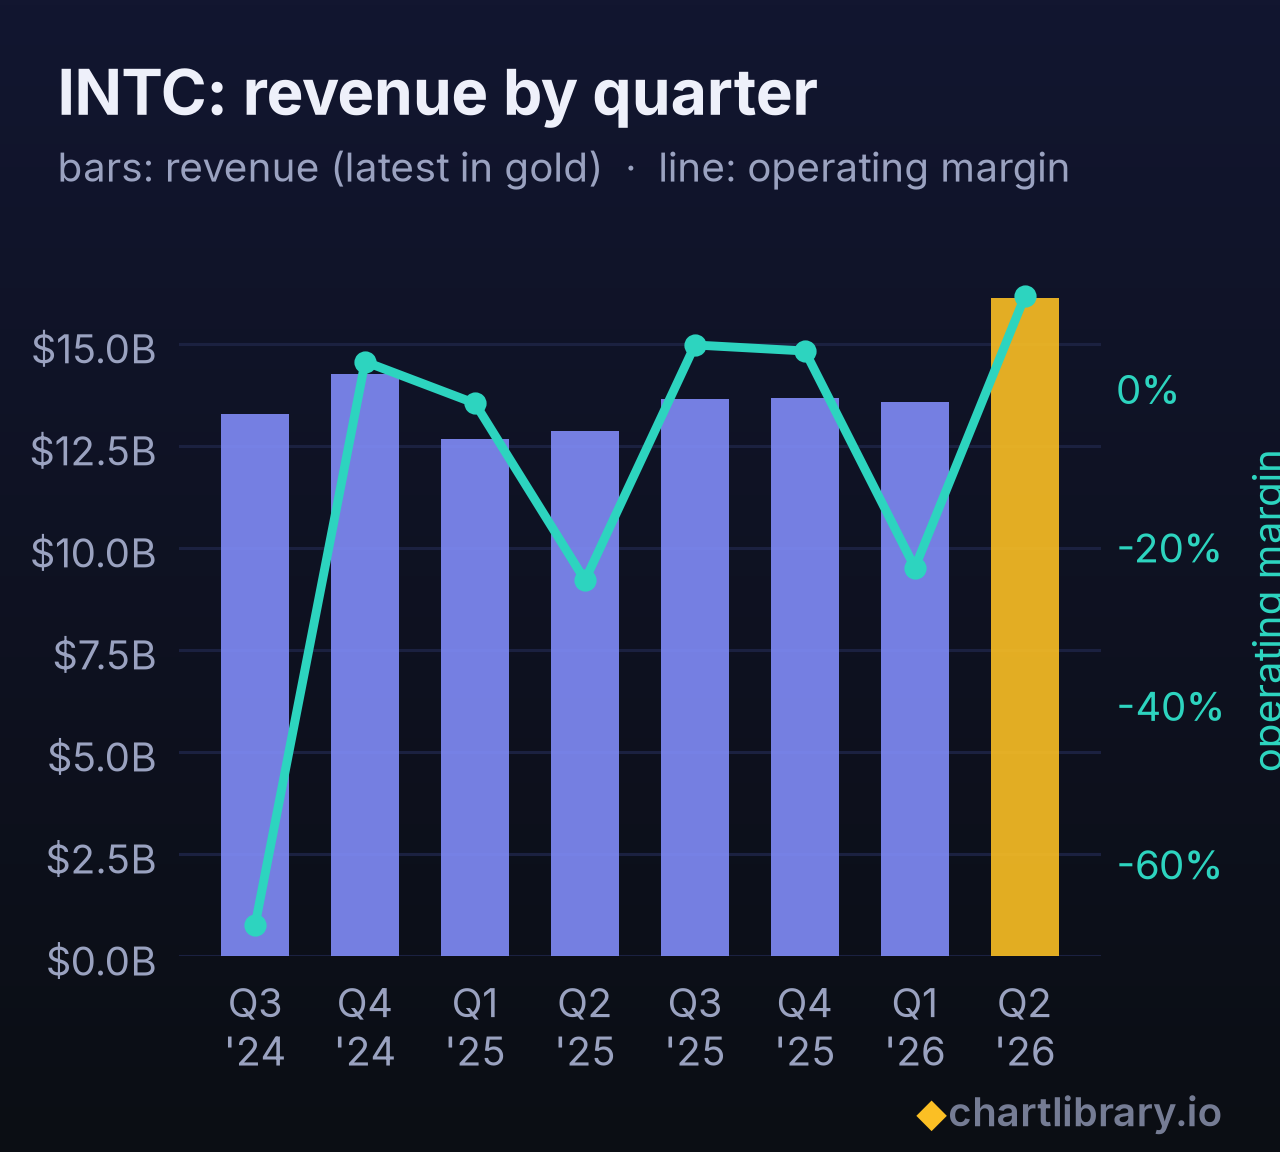
| Quarter | Revenue | vs a year ago | Gross margin | Op. margin | EPS | Op. cash flow |
|---|---|---|---|---|---|---|
| Q2 2026 | $16.13B | +25.4% | 40.4% | 11.1% | −2.16 | $7.01B |
| Q1 2026 | $13.58B | +7.2% | 39.4% | −23.1% | −0.73 | $1.10B |
| Q4 2025* | $13.67B | −4.1% | 36.1% | 4.2% | −0.10 | $4.29B |
| Q3 2025 | $13.65B | +2.8% | 38.2% | 5.0% | 0.90 | $2.55B |
| Q2 2025 | $12.86B | +0.2% | 27.5% | −24.7% | −0.67 | $2.05B |
| Q1 2025 | $12.67B | −0.4% | 36.9% | −2.4% | −0.19 | $813M |
| Q4 2024* | $14.26B | −7.4% | 39.2% | 2.9% | −0.03 | $3.17B |
| Q3 2024 | $13.28B | −6.2% | 15.0% | −68.2% | −3.88 | $4.05B |
From its filings, latest filed quarter first. *Q4 is the full year minus the first three quarters.
How it traded on its last reports
| Report | Opened | Open to close | Day |
|---|---|---|---|
| Jul 23, 2026 | −1.4% | −0.9% | −2.3% |
| Apr 23, 2026 | +23.1% | +0.4% | +23.6% |
| Jan 22, 2026 | −13.7% | −3.8% | −17.0% |
| Oct 23, 2025 | +4.9% | −4.3% | +0.3% |
| Jul 24, 2025 | −8.6% | +0.1% | −8.5% |
| Apr 24, 2025 | −8.2% | +1.6% | −6.7% |
| Jan 30, 2025 | +0.4% | −3.3% | −2.9% |
| Oct 31, 2024 | +6.9% | +0.9% | +7.8% |
The session that reacted: the report day or the next one, whichever gapped more (the calendar doesn't say before or after the bell).
What investors argue about
- Q3 was a small beat, but the Q4 sales range of $15.000 billion to $16.000 billion sits about $1 billion below the Street at the high end and below Q3 revenue.
- Data Center & AI rose 78% to $7.3 billion and Foundry rose 58% to $6.7 billion, while the company described a faster PC correction and an industry shortage of advanced organic substrates for EMIB packaging that limited how fast it could raise output.
- Zinsner attributed about $300 million of the Q4 revenue cut to a two-week Kiryat Gat shutdown and said a similar Q1 effect was still being assessed; Tan said CPU demand remained robust, Diamond Rapids was sampling, and Intel was engaged with a couple of highly strategic external customers for 18A-P. BofA and Roth both cut the stock to Neutral after the call.
Numbers to know
- Q3 2026: revenue $16.513 billion versus a $16.467 billion estimate; adjusted EPS $0.52 versus $0.40.
- Q4 outlook: sales $15.000 billion to $16.000 billion versus a $17.045 billion estimate; adjusted EPS $0.25 versus $0.43; GAAP EPS $0.10 versus $0.15.
- TTM: revenue $56.217 billion, revenue growth 25.4%, gross margin 36.7%, operating margin -6.8%, diluted EPS -$2.66, price-to-sales 8.36, debt-to-equity 0.96.
The 10 similar charts and the levels
The full detail
The news
· Fri 06:31 — Intel Issues Weak Forecast and Flags PC Market Weakness
The print itself was a small beat, but the December-quarter guide is the story: adjusted EPS $0.25 vs $0.43 and a sales range about $1B below the Street at the high end, plus GAAP EPS $0.10 vs $0.15. CFO David Zinsner tied about $300M of the Q4 revenue cut and about 200 basis points of gross margin to the Kiryat Gat explosion, said the fab was down two weeks, and said a similar revenue hit is still being assessed for Q1. Management also flagged a faster PC correction, with 2026 PC unit TAM down about 12% and second-half units down more than 20%, even as Data Center & AI revenue was $7.3B, up 78% year over year, and Foundry revenue was $6.7B, up 58%. BofA and Roth both cut the stock to Neutral after the call; the $1.9B Classiq deal price is secondary.
The last times like this
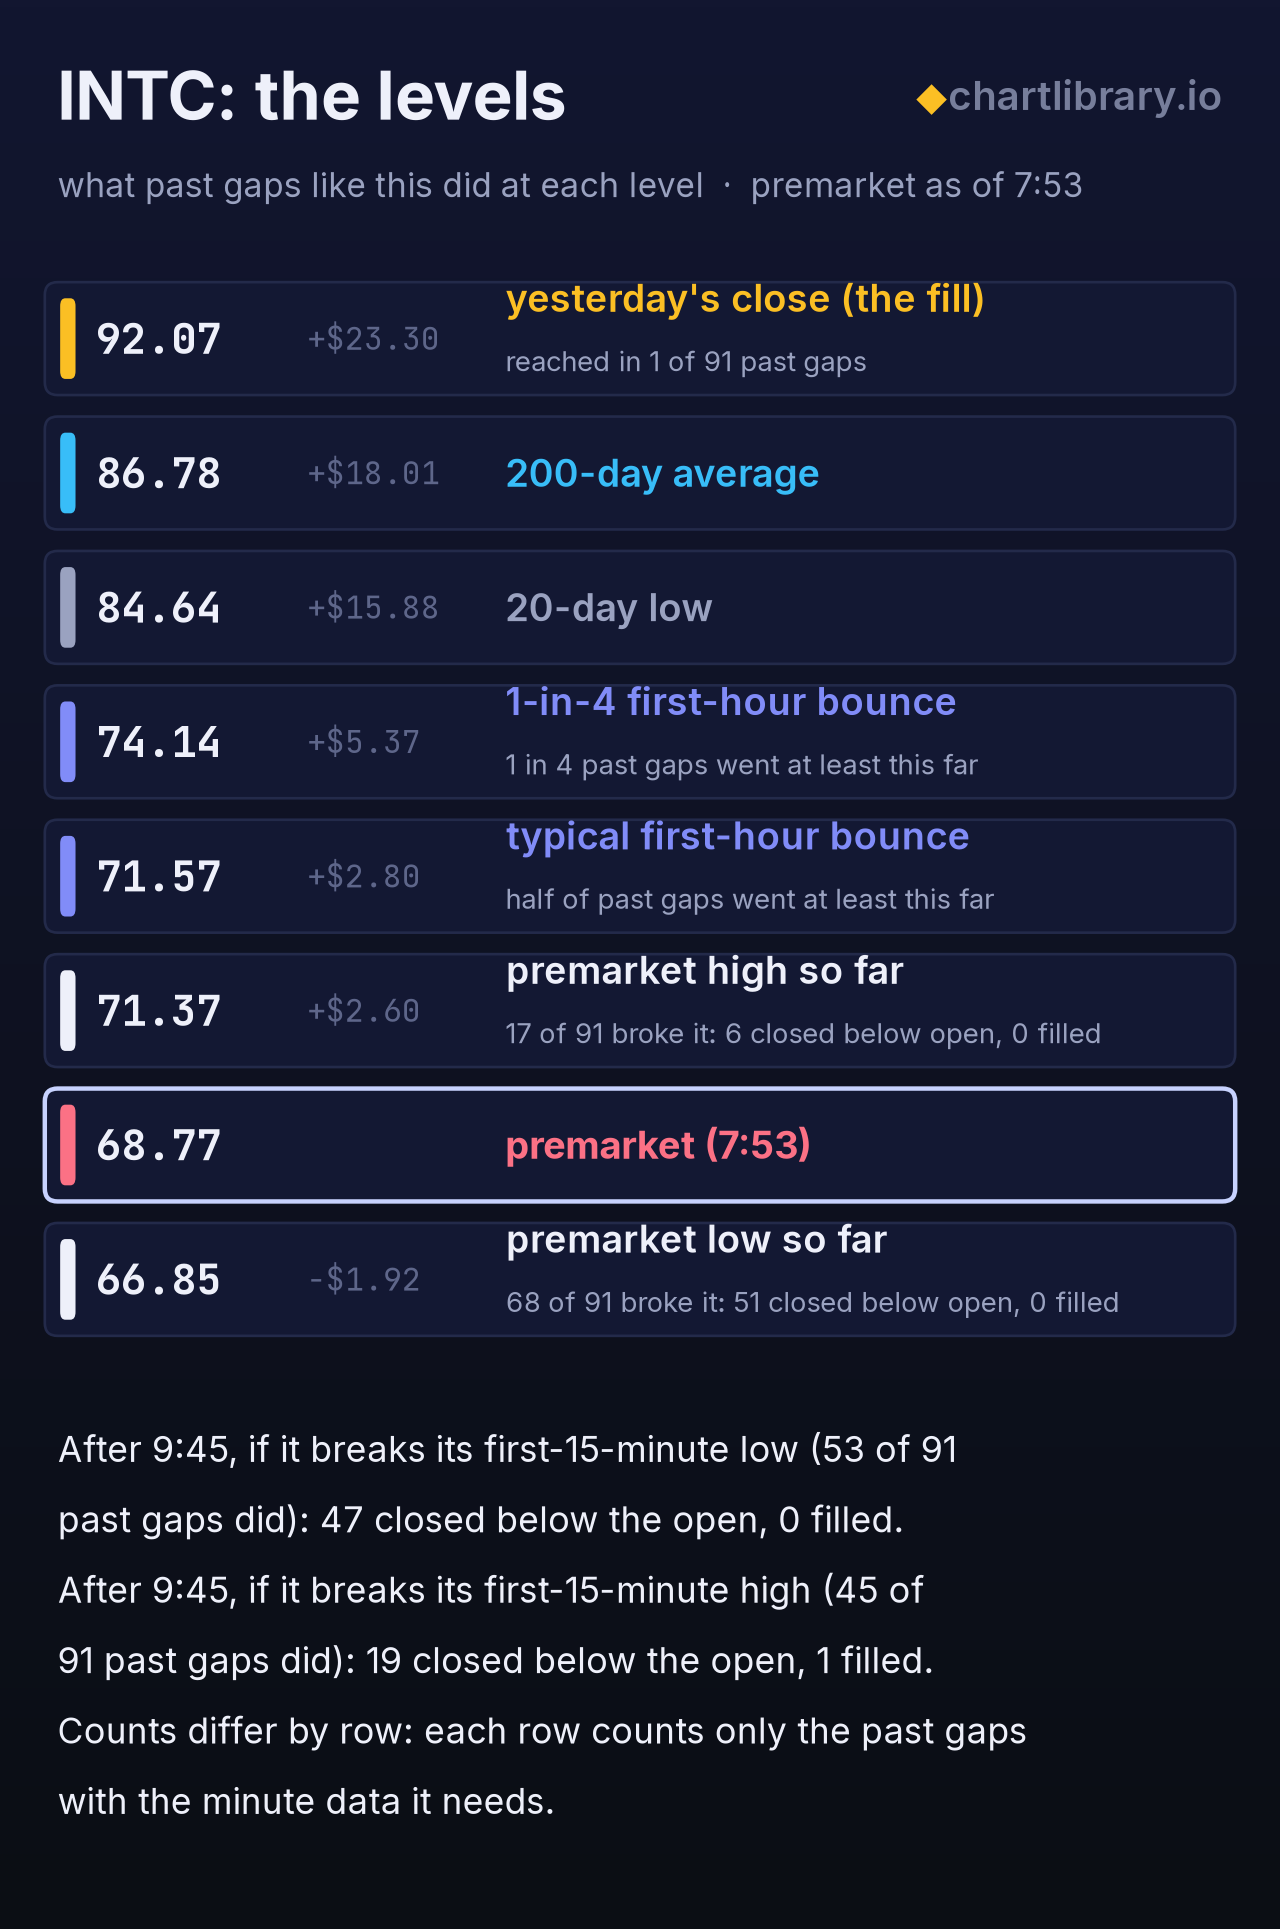
In 91 past news gaps down of this size on a morning the market also gapped down, 8 in 10 closes landed between $59.83 and $75.41 at today's price; yesterday's close, the fill, is $92.07.
INTC's own last 3 similar gaps: 2 kept going, 1 came back toward the open without filling, none filled. The latest, Aug 2 '24, did not fill and closed a little below the open.
- If it breaks below its premarket low so far ($66.85, as of 7:53): 68 of 91 past gaps like this did. Of those 68, 51 closed below the open and 0 went on to fill.
- If it breaks below its first-15-minute low after 9:45: 53 of 91 past gaps like this did. Of those 53, 47 closed below the open and 0 went on to fill.
Mornings that looked like this one before the bell. Of the 10 closest premarket look-alikes, 5 popped at the open, then sold off; 2 slid from the open and kept going; the other 3 each went their own way. None filled the gap.
The next week or two (the 84 most recent similar gaps). Five sessions later they were above the gap-day open about 4 in 10 times; the middle one closed near $67.01 at today's price, with most between $61.59 and $73.85. Ten sessions later, about 4 in 10 were above the gap-day open. Within the week, about 5 in 10 traded through the gap day's high, and about 3 in 10 closed the fifth session beyond the gap day's low.
Levels
| Premarket (as of 7:53) | $68.77 (−25.3%) |
| Premarket high / low so far | $71.37 / $66.85 |
| Yesterday's close (the fill) | $92.07 |
Peers and options
Co-mentioned in the news:
| Premarket | Last 20 days | |
| AMD | −8.9% | −8.0% |
| NVDA | −3.1% | −7.5% |
| QCOM | −4.7% | +1.8% |
| MU | −6.1% | −14.9% |
| AVGO | −4.0% | +0.4% |
| XLK (sector ETF) | −3.6% |
1 of the 5 peers trading premarket is moving with it (AMD −8.9%); the rest are not.
Its −23.3% over the last 20 days is its own; peers' middle is −7.5%.
Options: at yesterday's close the $92 straddle expiring today priced a move of about ±8.3%. The premarket gap is −25.3%, 3.0× what options priced.
Numbers
| Premarket trading | active ($1.2B, 12% of a normal day) |
| A normal day for it | 4.4% (its 20-day average range) |
| Last 20 days | −23.3% |
What to watch
- Kiryat Gat production ramp the company said starts by the end of this week
- CFO still assessing whether the fab hit extends past the current Q4 and Q1 figures
The company
Intel designs and sells x86 CPUs for PCs and servers and runs Intel Foundry, which manufactures chips for its own products and is trying to win outside customers. What its investors watch: PC unit demand and OEM inventory against higher memory costs; Server CPU supply, substrates, and foundry customer commitments.
Every weekday by about 8:10 ET: the three most talked-about gap stocks, each with its chart and the 10 most similar past charts, and a page like this on each.