The number we are judged by — audited, not asserted.
The coverage record
comp_strength: low · match_quality: loose
conditions: normal · coverage: 0.81
drivers: sector_lagging, narrative_passive, earnings_near
“This one reads like a coin flip — the comp set doesn’t separate up from down here.”
Grounded vs a guess — same coverage, half the width
The coverage record above proves our band holds what it claims. This is the comparison that matters for an agent builder: against an ungrounded LLM doing the same job. We took 300 out-of-sample setups, asked a model (Claude Haiku) for its own 80% interval on the 5-day forward return, and put it next to Chart Library’s calibrated band — both scored against what actually happened.
| 80% interval for the 5-day move | Coverage | Mean width |
|---|---|---|
| Ungrounded LLM (its own interval) | 82.7% | 18.5 pts |
| Chart Library calibrated band | 82.7% | 10.3 pts — 44% tighter |
| Raw cohort (uncalibrated baseline) | 87.0% | 11.7 pts |
Identical coverage, 44% tighter band. We are explicit about what this is not: it is not a claim that we predict returns more accurately — the coverage is the same (~83%), so both are equally honest about how often the move lands in range. The difference is precision: an ungrounded model can only be calibrated by hedging ~2× as wide. Chart Library gives the same honesty in half the width, with a setup-specific band instead of a generic one — and a coverage receipt the model structurally cannot produce.
Method, stated plainly. 300 setups across five months (Feb–Jun 2026), large-cap and high-volatility names, sampled out-of-sample. Every test date is after the model’s training cutoff, so the LLM cannot have memorized the outcome — the fair version of the ungrounded-agent task. The calibrated band and the realized return both come straight from the public /api/v1/replay endpoint, so you can reproduce it yourself: pull a band, ask any model for its interval, score both against the realized move. The result held in every one of the five months. (An earlier 80-setup pilot showed a coverage edge too; at n=300 that washed out to zero — which is the honest result, and why the claim here is width, not accuracy.)
It isn’t a small-model artifact. We re-ran the comparison against three model tiers — Haiku 4.5, Sonnet 4.6, and Opus 4.8, a frontier model. Every tier hedged to roughly the same width (~18–19 points) at comparable coverage, leaving our calibrated band 42–46% tighter against all three. The telling part: the frontier model was not sharper — Opus produced the widest interval of the three and over-covered, hedging more, not less. Capability doesn’t buy precision on this task. Grounding does.
What a blind judge actually preferred
Two identical Claude agents, identical prompts, 50 out-of-sample subjects. One could call Chart Library; the other worked from raw price and headlines alone. A second model, blind to which agent held which tools, scored the reasoning and preferred the grounded reasoning on every scenario. We’re explicit about what this does and doesn’t show: an agent given a research desk will investigate more, so a gap is expected by construction. What the blind judge adds is that the grounded reasoning was preferred even when both agents reached the same conclusion — and even when that conclusion later proved wrong (see NUVL). This is not evidence that our comp set predicts returns. It’s evidence that an agent reasons more like a careful analyst when it can pull the historical record instead of guessing it.
The harder test, specified and queued. The genuinely un-rigged version of this is same-toolkit-both-arms, the only difference being whether the calibration receipt is in context — isolating the moat (calibration), not tool count. That run doesn’t exist yet; we’ll publish its design, and its result, whether or not it favors us.
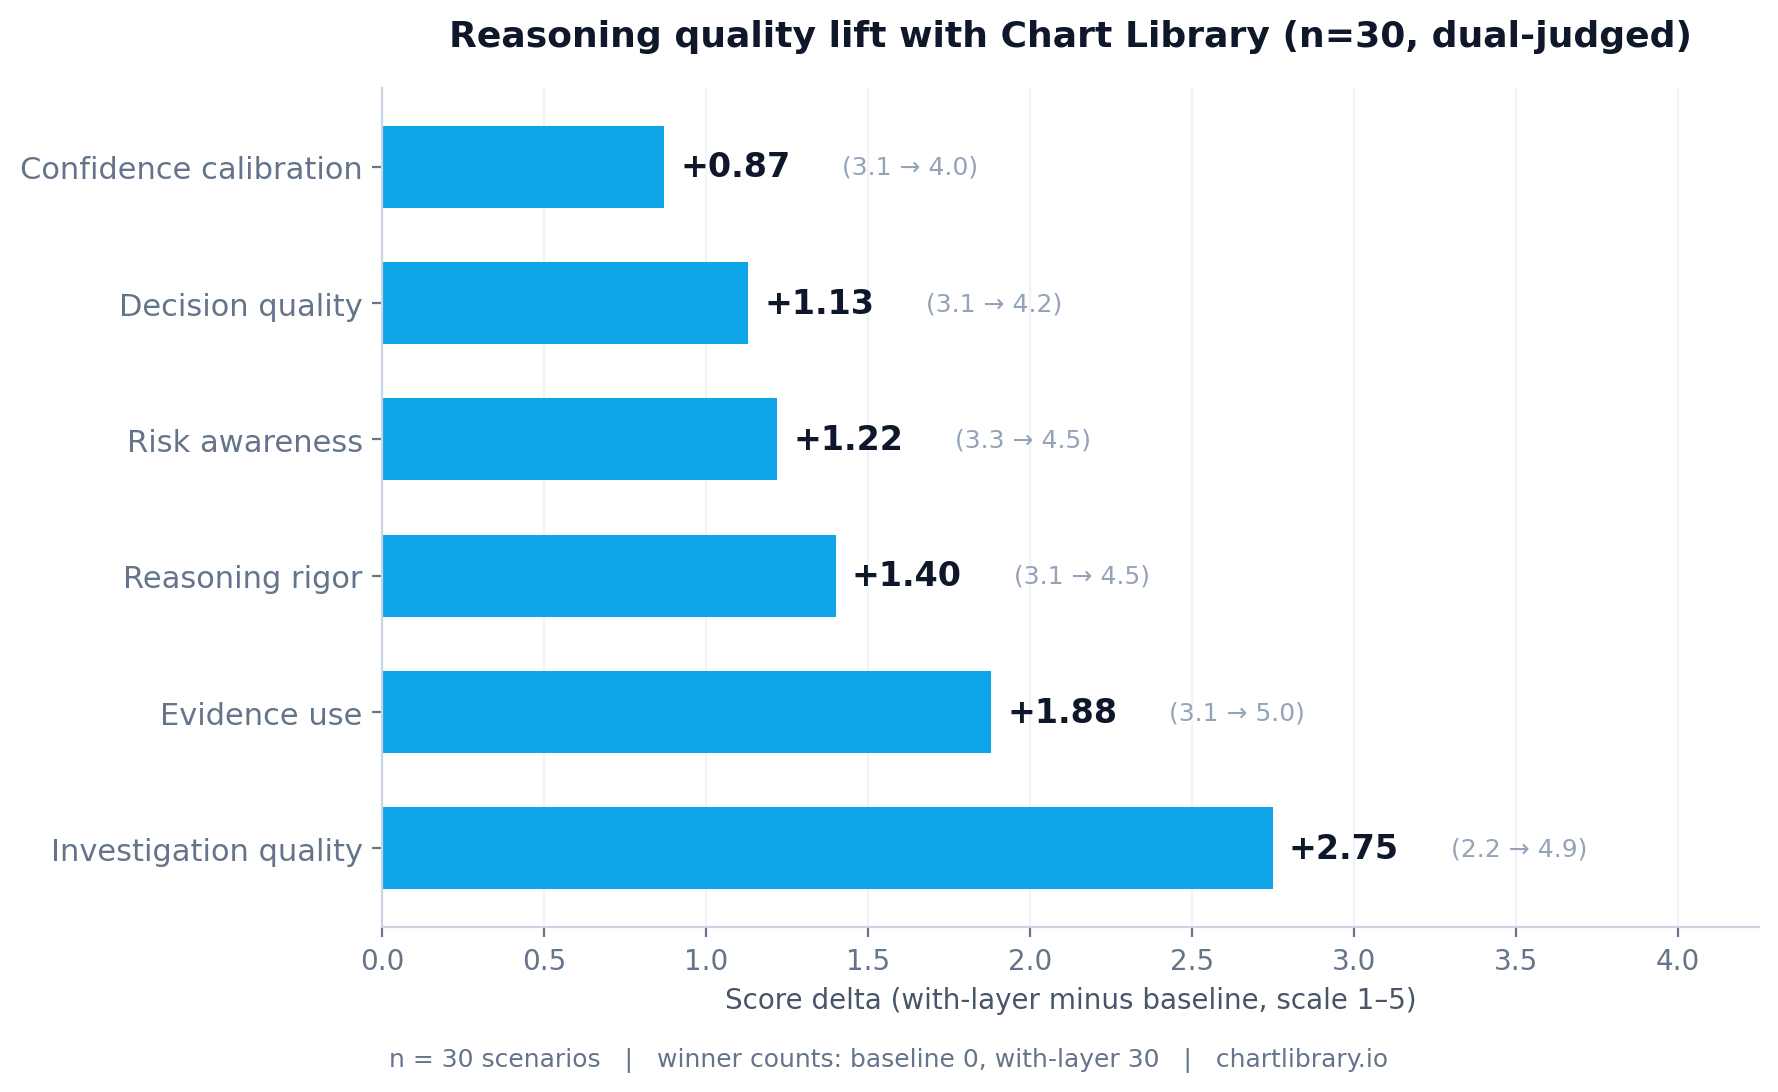
Per-dimension lift
Score deltas from the rigor-controlled run (n=30, A/B presentation order randomized per scenario, dual-judge averaged). Every dimension positive, with the largest lift on investigation_quality — exactly the one you’d expect when the only thing changing is the toolkit.
| Dimension | Baseline | With-layer | Δ | paired t |
|---|---|---|---|---|
| Investigation quality | 2.17 | 4.92 | +2.75 | 32.13 |
| Evidence use | 3.07 | 4.95 | +1.88 | 26.66 |
| Reasoning rigor | 3.13 | 4.53 | +1.40 | 18.11 |
| Risk awareness | 3.28 | 4.50 | +1.22 | 13.24 |
| Decision quality | 3.10 | 4.23 | +1.13 | 11.16 |
| Confidence calibration | 3.15 | 4.02 | +0.87 | 12.84 |
The methodology
Two Claude Haiku agents. Identical prompts. Identical out-of-sample scenarios.
- Agent A (baseline): tools for
get_recent_ohlcandget_recent_headlines. Raw data only. - Agent B (with-layer): same plus
cohort_analyze,get_market_context,narrative_pulse. The three intelligence-layer tools. - Scenarios: 50 random (symbol, date) subjects from 2024-onward, balanced across winners, losers, and neutral outcomes.
- Both agents run an Anthropic tool-call loop (max 8 iterations), choosing what to investigate, then output a JSON decision.
- Judge: Claude Sonnet, sees both full traces + final responses, scores each agent on 6 dimensions of reasoning quality. The judge does not know which agent has which toolkit.
- Rigor controls (on the n=30 follow-up): A/B presentation order randomized per scenario; each pair judged twice with swapped order; scores averaged; winner by consensus.
The notable observation: the rigor-controlled run produced larger deltas than the pilot. The controls didn’t expose hidden bias — they revealed that pilot measurement noise had been working slightly against our result, not for it.
The scenario that explains what we actually do — NUVL 2024-09-13
The most revealing scenario in the run involved Nuvalent (NUVL) on September 13, 2024. Both agents were asked: should this be a long entry, 5-day hold?
Both agents reached the same conclusion: no_position. Over the next 5 trading days, NUVL ran +23.5%. Both agents got the outcome wrong.
The judge still ranked Agent B substantially higher. Verbatim:
“Agent B’s investigation was substantially more rigorous, leveraging market context, comp set analytics, and narrative pulse to produce a multi-factor, data-grounded argument, whereas Agent A relied solely on price action from a single tool call and skipped obvious available evidence.”
This is the whole proposition. An intelligence layer doesn’t make your agent right more often. It makes your agent reason better. Sometimes the better-reasoned conclusion is to stay out of a trade that turns out to be a winner. That’s how research works: the realized outcome was the right tail of a distribution; the reasoning that said “stay out” was correct given the available evidence.
The bidirectional value — saves losses, catches winners
Two scenarios in the run showed the agents reaching different decisions. In both, the agent with Chart Library made the better call.
What this means about the product
Most “AI trading” tools promise to predict markets. They mostly don’t work — no signal applied mechanically beats SPY net of costs. Chart Library does something different. We’re not in the prediction business. We’re in the reasoning substrate business.
We give AI agents the kind of structured historical context that lets them think well about uncertain situations — the way a Bloomberg Terminal supports an analyst’s reasoning. The validation that matters for an intelligence layer isn’t whether mechanical use of its outputs produces alpha (almost certainly not). It’s whether agents using it reason better. The evaluation on this page measured exactly that, and the answer was yes, decisively.
Try the layer a blind judge preferred on every scenario.
Same engine, same tools the agents used — grounded in a coverage record you can verify. Free sandbox tier: 1,000 calls/day, no card required.