Graham McCain · Alphaforge Research · Published Sep 29, 2026 · 9:04 am ET · Revision 1
Scored over 5 trading sessions.
AI summary
CarMax reported second-quarter revenue of $7.9 billion, up 19.5%, with comparable used unit sales rising 13.0% and earnings per share of $1.16 versus $0.64 a year ago. The note views the pre-print session, which closed down 1.2% on triple normal volume, as a weak setup. The key figures are the 13.0% unit growth and the $1.16 EPS against a $0.64 prior.
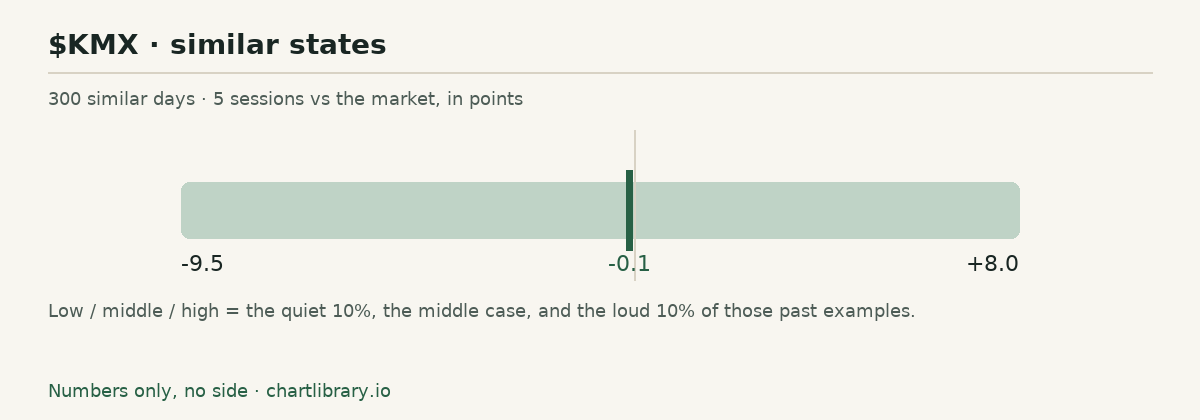
The stock's own history shows its last four earnings days closed down 20.1%, 4.2%, 15.1% and 9.0%. The note's historical five-session range for similar states is -9.5 / -0.1 / +8.0. The strongest other reading points to declining gross profit per unit and a strategy update set for November 3. The immediate checkpoint is the session close on the day of the release.
Two paragraphs generated from the note. The authored note below is the record. Numbers only, no side.
1. The state
As of the 2026-09-28 close
Monday's close was $56.55, down 1.2% from Friday's $57.21, 13.4% under the August 26 high of $65.28, 30.6% over the close of 120 sessions ago, and 18.1% over the 200-day average. Volume was 3.0 times the recent norm and $360 million traded. The close sat in the bottom eighth of a 4.4% range after a flat open.
2. What's new
On September 29 at 07:00 ET CarMax filed an 8-K under Items 2.02 and 9.01 with the second-quarter release: net revenues $7.9 billion, up 19.5%; comparable store used unit sales up 13.0%; retail used units 227,391, up 13.8%; wholesale units.
3. What that does to the state
The release set no revenue or earnings guide; what moved are the second-quarter figures against a year-ago quarter that had fallen, the return of repurchases, and a November 3 date for the strategy.
300 similar days · 247 stocks · 226 sessions · 1h band
| Vs the market, in points | Low | Middle | High | Share up |
|---|
| 1 session | -4.7 | +0.0 | +4.1 | 51% |
| 5 sessions | -9.5 | -0.1 | +8.0 | 49% |
| 10 sessions | -12.8 | +0.4 | +9.4 | 53% |
The band is the prior close's neighborhood — what followed similar states as of the cutoff.
4. Same state, or a new one
A completed Tuesday close outside the 1-session band, a filing that puts numbers on the third quarter or on the November 3 Strategic Update before that date, or a repurchase disclosure larger than modest, would make Tuesday's filing the needle.
Monday's close was $56.55, down 1.2% from Friday's $57.21, on 6.36 million shares, 3.0 times the recent norm, and $360 million of stock, the session before the print. The open was $57.17, the high $58.77, the low $56.24, and the close sat in the bottom eighth of a 4.4% range. The used-car names sold off together, with no item on any of them in the desk's wire feed that day: CVNA closed down 7.1% on 3.7 times its recent volume, LAD down 4.2%, AN down 3.4%, against a 0.7% decline in SPY. The close is 13.4% under the 52-week high of $65.28 from August 26, 30.6% over the close of 120 sessions ago, and 18.1% over the 200-day average of $47.89. From the $30.88 close of November 6, 2025, the day the previous chief executive's departure and a preliminary third-quarter comparable-unit decline of 8% to 12% were announced and the stock fell 24.3%, Monday's close is up 83.1%. Keith Barr's first day as chief executive was March 16; the close before it was $41.84.
The 8-K was accepted at 07:00:30 ET Tuesday. Net revenues were $7.9 billion, up 19.5% from $6,594.7 million; comparable store used units rose 13.0%, against a 6.3% decline in the same quarter a year ago; retail used units were 227,391, up 13.8%, at an average selling price of $27,623, up 6.3%; wholesale units were 160,344, up 15.9%. Gross profit per retail used unit was $2,105, down $111, and per wholesale unit $858, down $135; total gross profit was $799.5 million, up 11.4%. CarMax Auto Finance income was $135.6 million, up 32.1%, with the loan loss provision at $113.4 million against $142.2 million a year ago and the interest margin at 6.6% of average loans, unchanged. SG&A was $628.6 million, up 4.6%. Net earnings were $165.3 million, $1.16 a diluted share against $0.64. The company repurchased no shares in the quarter, intends to resume repurchases at a modest level in the third quarter with $1.31 billion of authorization remaining, and will host a virtual Strategic Update on November 3 at 8:00 ET. The wire's consensus going in was $0.73 and $6.98 billion.
The quarter before, reported June 17, had revenue up 6.2%, comparable units down 0.8% and EPS of $1.31 against $1.38; the stock closed that day down 9.0% and the next day up 13.1%. The four print days before this one closed down 20.1%, 4.2%, 15.1% and 9.0%, and five sessions after each the stock stood 19.3% lower, 4.4% lower, 20.5% lower and 1.5% higher than the pre-print close. The exam is Monday's 5-session excess band, -9.5 / -0.1 / +8.0, from a state the memory filed before the print. The pre-market tape from the consolidated feed, 15 minutes delayed, through the 08:45 ET bar: the stock traded between $55.91 and $56.85 from 04:05 to 05:45, printed $58.10 to $59.90 in the 05:50 bar as the release crossed the wire, an hour before the 8-K, and stood at $60.10 at 08:45, +6.3% against Monday's close, with a pre-market high of $61.22, a low of $55.91 before the release, and about 717 thousand shares.
Other reading, tape, and sources
The other reading
Comparable units up 13.0%, revenue up 19.5%, a provision $28.8 million lower and repurchases returning, six months into a new chief executive, is the quarter the four red print days were pricing against, so the state before the print, a weak close on three times volume, is the part that is stale. The other reading: the 13.0% is against a quarter that fell 6.3%, gross profit per retail unit fell $111 and per wholesale unit $135, SG&A rose 4.6% with the $200 million target still an exit-rate promise, no share was bought back in the quarter, and the strategy detail is a November 3 event, not a number in this release.
What would change this
A completed Tuesday close outside the 1-session band, a filing that puts numbers on the third quarter or on the November 3 Strategic Update before that date, or a repurchase disclosure larger than modest, would make Tuesday's filing the needle. A close inside the band, with the release as the only new document, would not.
The tape
Monday's close was $56.55, down 1.2% from Friday's $57.21, 13.4% under the August 26 high of $65.28, 30.6% over the close of 120 sessions ago, and 18.1% over the 200-day average. Volume was 3.0 times the recent norm and $360 million traded. The close sat in the bottom eighth of a 4.4% range after a flat open. The memory files the state as a 120-day uptrend, above its 200-day, off the 52-week high, with overhead supply, heavy volume, a weak close, and some peers moving; Friday's state was the same on ordinary volume.
What was filed
On September 29 at 07:00 ET CarMax filed an 8-K under Items 2.02 and 9.01 with the second-quarter release: net revenues $7.9 billion, up 19.5%; comparable store used unit sales up 13.0%; retail used units 227,391, up 13.8%; wholesale units 160,344, up 15.9%; used vehicle sales up 19.7% and wholesale vehicle sales up 18.2%; gross profit per retail used unit $2,105, down $111, and per wholesale unit $858, down $135; total gross profit $799.5 million, up 11.4%; CarMax Auto Finance income $135.6 million, up 32.1%, on a $113.4 million provision against $142.2 million; SG&A $628.6 million, up 4.6%, with the $200 million exit-rate savings target for the end of fiscal 2027 restated; net earnings $165.3 million, $1.16 a diluted share against $0.64; first-half revenue $15,891.4 million and EPS $2.47; digital capabilities behind 81% of retail unit sales, omni sales 68% and online 13%. No shares were repurchased in the quarter; repurchases resume at a modest level in the third quarter, with $1.31 billion remaining. A virtual Strategic Update is set for November 3 at 8:00 ET. The chief executive quoted is Keith Barr, in the role since March 16. A year ago the same quarter had revenue down 6.0%, comparable units down 6.3% and EPS of $0.64 against $0.85. The wire's consensus was $0.73 and $6.98 billion.
The numbers around the move
The release set no revenue or earnings guide; what moved are the second-quarter figures against a year-ago quarter that had fallen, the return of repurchases, and a November 3 date for the strategy. The 5-session excess band on Monday's state is -9.5 / -0.1 / +8.0 across 300 analogs, 1.5 times the base width for this kind of session. A completed Tuesday close inside the 1-session band, -4.7 / +4.1 from $56.55, or $53.89 to $58.87, leaves this neighborhood in place. The pre-market last of $60.10 in the 08:45 ET bar, from the consolidated feed, sits +6.3% from Monday's close, outside that 1-session band; the band is scored on the completed close, not the pre-market.
What the stock did
The print arrived before the open, so the memory holds no reaction session yet. Monday's completed session, the one before the print, closed at $56.55, down 1.2% on 3.0 times recent volume, with the close in the bottom eighth of the range. The pre-market tape from the consolidated feed through the 08:45 ET bar: $55.91 to $56.85 before the release, $58.10 to $59.90 in the 05:50 bar, a high of $61.22, and $60.10 at 08:45, +6.3% against Monday's close. The completed Tuesday close enters the memory with tonight's ingest.
The comparison
Five-session excess -9.5 / -0.1 / +8.0 across 300 analogs on the 1-hour scale, with the up-share at 49%. One session -4.7 / +0.0 / +4.1. Ten sessions -12.8 / +0.4 / +9.4. The band is 1.5 times the base width. The stock's own last four print days: September 25, 2025, down 20.1% on the day and 19.3% under the pre-print close five sessions on; December 18, down 4.2% and 4.4%; April 14, down 15.1% and 20.5%; June 17, down 9.0% and then 1.5% over the pre-print close five sessions on. June 20, 2025, the print before those, closed up 6.6%. The comparisons are state and shape, not a forecast, and they imply no side.
Sources
Monday's tape and band are the September 28 state packet. The quarter is the September 29 8-K and exhibit 99.1; the year-ago quarter is the September 25, 2025 exhibit 99.1; the June quarter is the June 17 exhibit 99.1; the November 6, 2025 leadership change and preliminary outlook are that day's exhibit 99.1. Print-day closes, the 52-week range, the 200-day average and the peer closes are stored daily bars. The pre-market tape is the consolidated feed's 5-minute aggregates read at 09:04 ET, before the open and 15 minutes delayed, so the last bar is 08:45 ET; the completed session enters the memory with tonight's ingest. The consensus figures and the wire's 05:58 ET headline time are from the desk's wire feed and are not a source for any number in the state or the release.
- September 28 completed-session state packet for KMX · Available Sep 28, 2026 · 9:00 pm ET
- CarMax 8-K, September 29, 2026: Item 2.02, second quarter fiscal 2027 results · Available Sep 29, 2026 · 7:00 am ET
- CarMax exhibit 99.1, September 29, 2026: second quarter fiscal 2027 release · Available Sep 29, 2026 · 7:00 am ET
- CarMax exhibit 99.1, June 17, 2026: first quarter fiscal 2027 release · Available Jun 17, 2026 · 6:54 am ET
- CarMax exhibit 99.1, September 25, 2025: second quarter fiscal 2026 release · Available Sep 25, 2025 · 7:07 am ET
- CarMax exhibit 99.1, November 6, 2025: leadership changes and preliminary third quarter outlook · Available Nov 6, 2025 · 6:55 am ET
- Polygon consolidated 5-minute aggregates for KMX, September 29, 2026, pre-market, delayed 15 minutes, read at 09:04 ET · Available Sep 29, 2026 · 9:02 am ET