Graham McCain · Alphaforge Research · Published Sep 14, 2026 · 8:31 am ET · Revision 1
Scored over 5 trading sessions.
1. The state
As of the 2026-09-11 close. Session 1 has closed.
At 08:20:26 Eastern on September 14, Yahoo's captured premarket quote was $13.08, down 3.75% from Friday's $13.59 close. Completed daily history through September 11 shows a 20-session decline of 11.92%, compared with 2.35% for QQQ. Friday volume was 368,900 shares, just 0.35 times the preceding 20-session average.
2. What's new
London-headquartered Gorilla combines security and data technologies with an expanding AI infrastructure business.
3. What that does to the state
H1 revenue reached $78.4 million, but gross profit was only $3.84 million: a calculated 4.9% margin, versus 34.2% a year earlier.
300 similar days · 213 stocks · 252 sessions · 1h band
| Vs the market, in points | Low | Middle | High | Share up |
|---|
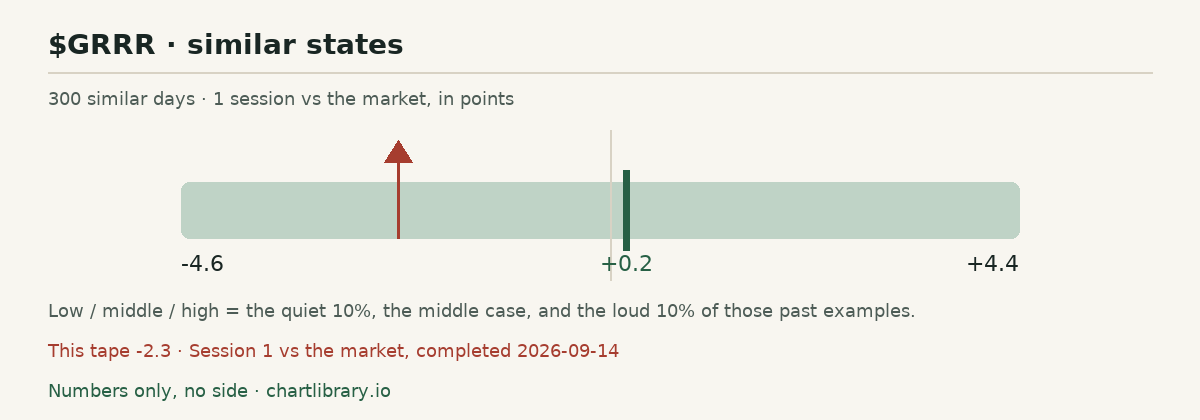
| 1 session | -4.6 | +0.2 | +4.4 | 53% |
| 5 sessions | -8.4 | -0.1 | +9.5 | 50% |
| 10 sessions | -13.1 | -0.7 | +14.6 | 46% |
The band is the prior close's neighborhood — what followed similar states as of the cutoff.
4. Same state, or a new one
Stayed in yesterday's neighborhood
Session 1 vs the market: -2.3. Prior-state 1-session range: -4.6 / +0.2 / +4.4.
We would become more constructive after identifiable capacity acceptance, a reconciled timetable, customer collections and a disclosed route to improving gross margins.
Session 1: -2.3 vs band -4.6/+0.2/+4.4, stayed in range. Session 5: -4.8 vs band -8.4/-0.1/+9.5, stayed in range. Session 10: +2.2 vs band -13.1/-0.7/+14.6, stayed in range. Scorecard
Other reading, tape, and sources
The other reading
The strongest positive case is that today's poor economics reflect a transition. If accepted capacity produces recurring revenue with attractive utilization, capital spending and financing can be the necessary cost of building a much better business. Rejecting every financed expansion would miss successful infrastructure projects.
The strongest negative case is that the common shareholder becomes the residual funder of delays and replacement costs. Customers can receive useful compute and suppliers can be paid even when equity returns disappoint. Debt at the parent and project levels makes that distinction consequential.
Indonesia broadens the opportunity and the capital demands: July's update described a signed five-year Batam program with approximately $2.5 billion of expected revenue, while financing offers covering around 70% of expected costs were still progressing. Offers are not completed funding. Thailand's much larger illustrative campus revenue potential was explicitly uncontracted. We exclude it from firm revenue in our view. [5]
What would change this
We would become more constructive after identifiable capacity acceptance, a reconciled timetable, customer collections and a disclosed route to improving gross margins. A project-level schedule connecting procurement, debt drawdowns, service receipts and cash available to the parent would materially improve our confidence.
We would weaken the case after missed customer acceptance, contract reductions, deteriorating collections or repeated financing needs without corresponding operating progress. A higher revenue target with weaker cash conversion would not meet our test.
For the next five sessions, observe whether documented execution progress is accompanied by stabilization relative to QQQ. Price strength alone would not validate the business case, and a price decline alone would not invalidate a signed contract.
The tape
At 08:20:26 Eastern on September 14, Yahoo's captured premarket quote was $13.08, down 3.75% from Friday's $13.59 close. Completed daily history through September 11 shows a 20-session decline of 11.92%, compared with 2.35% for QQQ. Friday volume was 368,900 shares, just 0.35 times the preceding 20-session average. These are dated vendor observations, not a live price or evidence of who traded. [1,2,3]
The 20 completed sessions ending September 11 averaged approximately $15.35 million a day in close-price-times-volume. That is below our existing $25 million simulated-model liquidity guideline. Today's attention could change future liquidity, but one busy session would not rewrite the trailing record.
What was filed
London-headquartered Gorilla combines security and data technologies with an expanding AI infrastructure business. Its April Yotta expansion described another 20,736 GPUs in India and an approximately $2.8 billion project value. Yotta's own announcement corroborated the collaboration and targeted delivery by September 30. These figures describe a project, not annual cash earnings. [4]
The July 21 update described Yotta 1 as 5,120 GPUs and approximately $500 million of expected revenue over five years, with deployment targeted by end-August. It described Yotta 2 at approximately $2.5 billion under the then-current commercial framework. The April-to-July $300 million difference is not reconciled in the materials reviewed; we do not assume identical scope or silently keep the larger number. [5]
On September 8, Gorilla reported that equipment deliveries were underway and installation, integration and readiness work was progressing toward commissioning. This is a meaningful operational milestone, but it does not establish that all capacity is accepted, fully utilized or producing cash. [6]
The approximately $2 billion Supermicro arrangement announced in June concerns equipment supply. It supports the buildout and belongs on the procurement side of the analysis; adding it to Yotta customer-contract values would double count the economic chain. [7]
The numbers around the move
H1 revenue reached $78.4 million, but gross profit was only $3.84 million: a calculated 4.9% margin, versus 34.2% a year earlier. Adjusted EBITDA remained negative $14.6 million. The reported $25.4 million stock-compensation expense sits below gross profit, so removing that expense does not repair the gross-margin comparison. Management describes investment ahead of commissioning and utilization; it has not supplied a complete numerical bridge to mature margins. [8]
Management targets at least $200 million revenue in 2026, Q3 revenue of $48 million to $50 million, and $450 million to $500 million in 2027. On that arithmetic, reaching the 2026 minimum requires about $71.6 million to $73.6 million in Q4. The target therefore depends on further acceleration. [8]
June-end cash was $179.4 million. H1 operating cash flow was negative $4.3 million, with another $14.1 million spent on equipment. Contract assets rose to $104.8 million from $57.9 million; these are recognized amounts still subject to billing milestones. Equipment commitments were approximately $228.0 million, net of specified advances and recognized liabilities. July added $125 million of convertible principal after the June balance sheet. We cannot subtract June cash from today's capitalization and call the result a current enterprise value. [9]
June and July notes total $232 million of principal at 7.5%, equivalent to $17.4 million annual coupon before conversion or repayment. Both initially convert near $25.48, but permit conditional price resets beginning March 15, 2027. The June floor is $6; July Series B's floor is $8. Reset termination conditions, potential upward adjustment and additional interest shares matter. A high initial conversion price does not eliminate dilution at lower future prices. [10,11]
Using the disclosed July 29 base of 27.510 million ordinary shares, Friday's price implies about $373.9 million equity value before excluded contingent-value-right distributions, awards and conversion shares. Illustratively, principal-only conversion of both tranches at $25.4826 adds 9.10 million shares; a qualifying future reset to $13.59 would add 17.07 million. These are conditional ownership calculations, not forecasts or shares already issued. A conversion scenario must also remove the converted principal from debt. [11]
Our economic test is straightforward: durable service margins must cover project financing, hardware replacement and corporate costs while leaving enough cash for the eventual share count. Revenue multiples alone give too much credit before those deductions are known. We have not verified a current analyst consensus distribution or constructed a complete project-level valuation.
What the stock did
GRRR rose 5.73% on September 8, from $13.79 to $14.58, then declined 6.79% to September 11. That sequence coincides with the execution announcement, but overlapping market influences prevent us from isolating its effect. [2]
The observation suggests a question, not a conclusion: did the release change the perceived economics, or mainly draw attention to progress already expected? We cannot infer investor beliefs, forced selling or convertible hedging from that price path. The next complete session will let us separate a premarket indication from an actual closing response.
The comparison
Our philosophy treats recurring psychology as a source of questions. Investors can anchor on total contract size while lenders and customers care about delivery, collateral and acceptance. Those different constraints can make price responses uneven as a project advances. Here, we would track contract announcement, financing, delivery, commissioning and collection as separate events.
ChartLibrary returned an empty comparison packet for GRRR on the explicitly requested September 11 date. Its diagnostic lists several possible data or eligibility causes; it does not identify which applies. We report no analog win rate or implied directional advantage. The observed September window is descriptive history, not a tested trading strategy. [12]
Sources
Primary counterparty, supplier, issuer and SEC materials reviewed. Market baseline uses saved Yahoo daily bars and the exact 08:20:26 Eastern quote. Calculated margins, guidance bridge, volume and principal-only dilution are independently recomputed. June and July convertible floors differ; each tranche is sourced separately. Project values have different scopes and dates, and procurement is not added to customer revenue. No causal attribution, consensus estimate, completed project finance or analog odds is inferred. Source availability timestamps record retrieval cutoffs; announcement dates are stated separately.
- [1] Yahoo GRRR premarket snapshot · Available Sep 14, 2026 · 8:26 am ET
- [2] Yahoo GRRR daily history · Available Sep 14, 2026 · 8:26 am ET
- [3] Yahoo QQQ daily history · Available Sep 14, 2026 · 8:26 am ET
- [4] Yotta April India expansion announcement · Available Sep 14, 2026 · 8:26 am ET
- [5] Gorilla July 21 Asian infrastructure update · Available Sep 14, 2026 · 8:26 am ET
- [6] Gorilla September 8 Yotta execution update · Available Sep 14, 2026 · 8:26 am ET
- [7] Gorilla June Supermicro equipment arrangement · Available Sep 14, 2026 · 8:26 am ET
- [8] Gorilla August 24 H1 results and outlook · Available Sep 14, 2026 · 8:26 am ET
- [9] Gorilla H1 financial statements and notes · Available Sep 14, 2026 · 8:26 am ET
- [10] Gorilla June convertible prospectus: $6 reset floor · Available Sep 14, 2026 · 8:26 am ET
- [11] Gorilla August Series B prospectus: $8 reset floor and share capital · Available Sep 14, 2026 · 8:26 am ET
- [12] ChartLibrary GRRR September 11 comparison packet · Available Sep 14, 2026 · 8:26 am ET