← The October 27 morning issue
Armstrong World Industries, Inc. (AWI)
1. AWI −6.0%earnings + guidance
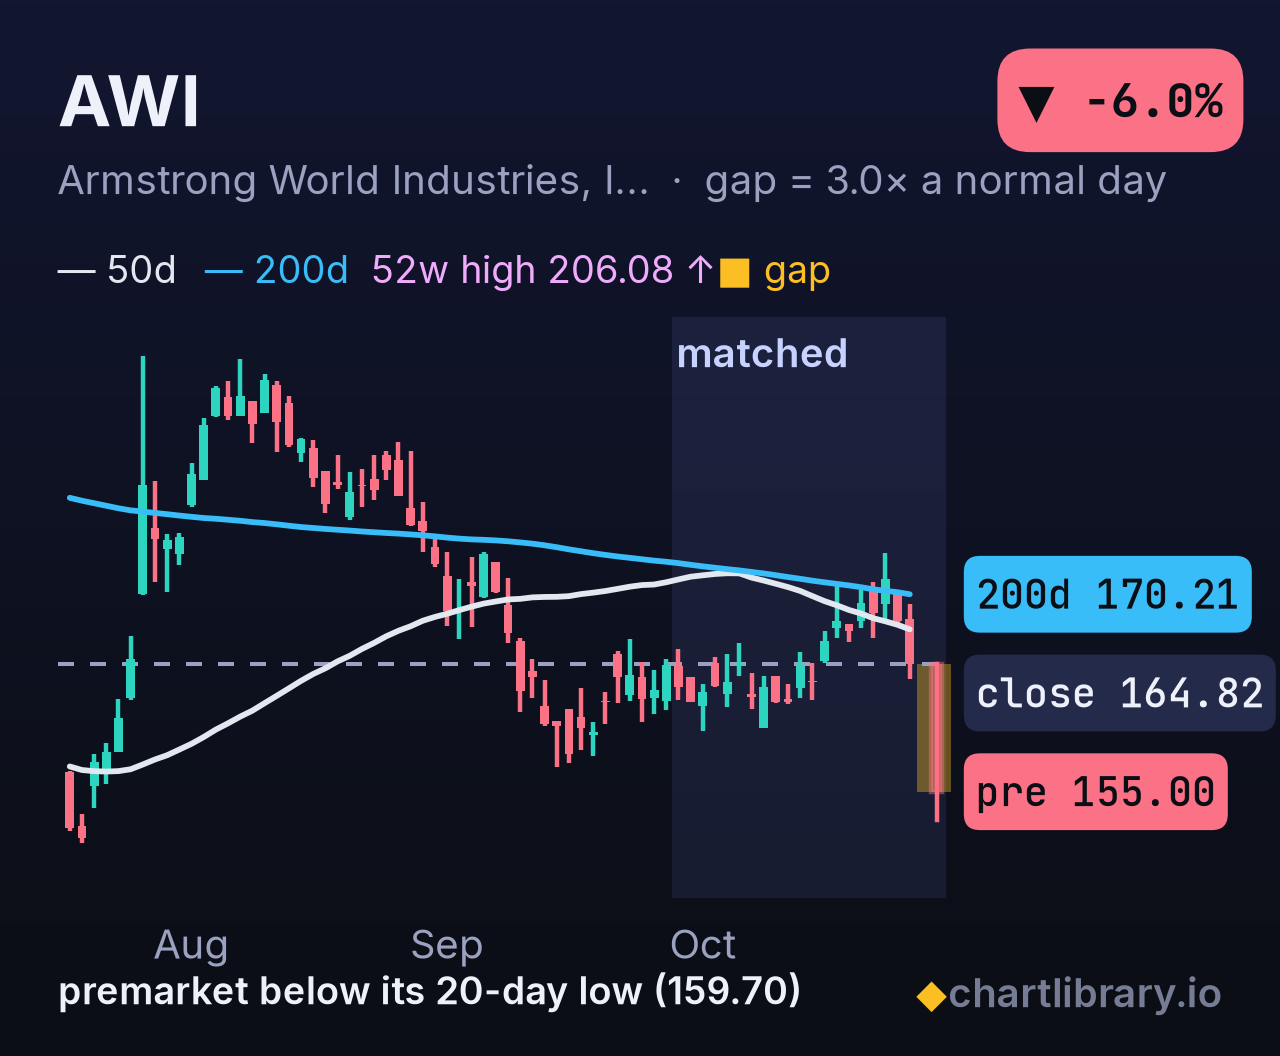
- Where it came from: Was 20% under its 52-week high, in a quiet stretch; today's gap is a big gap, about 3 normal days.
- Today: Q3 adj. EPS $2.26 vs $2.39 est, revenue $475.8M vs $472.6M est; FY26 adj. EPS guidance narrowed to $8.30-$8.40 (from $8.30-$8.50) vs $8.43 est, sales guidance raised to $1.788B-$1.803B vs $1.787B est.
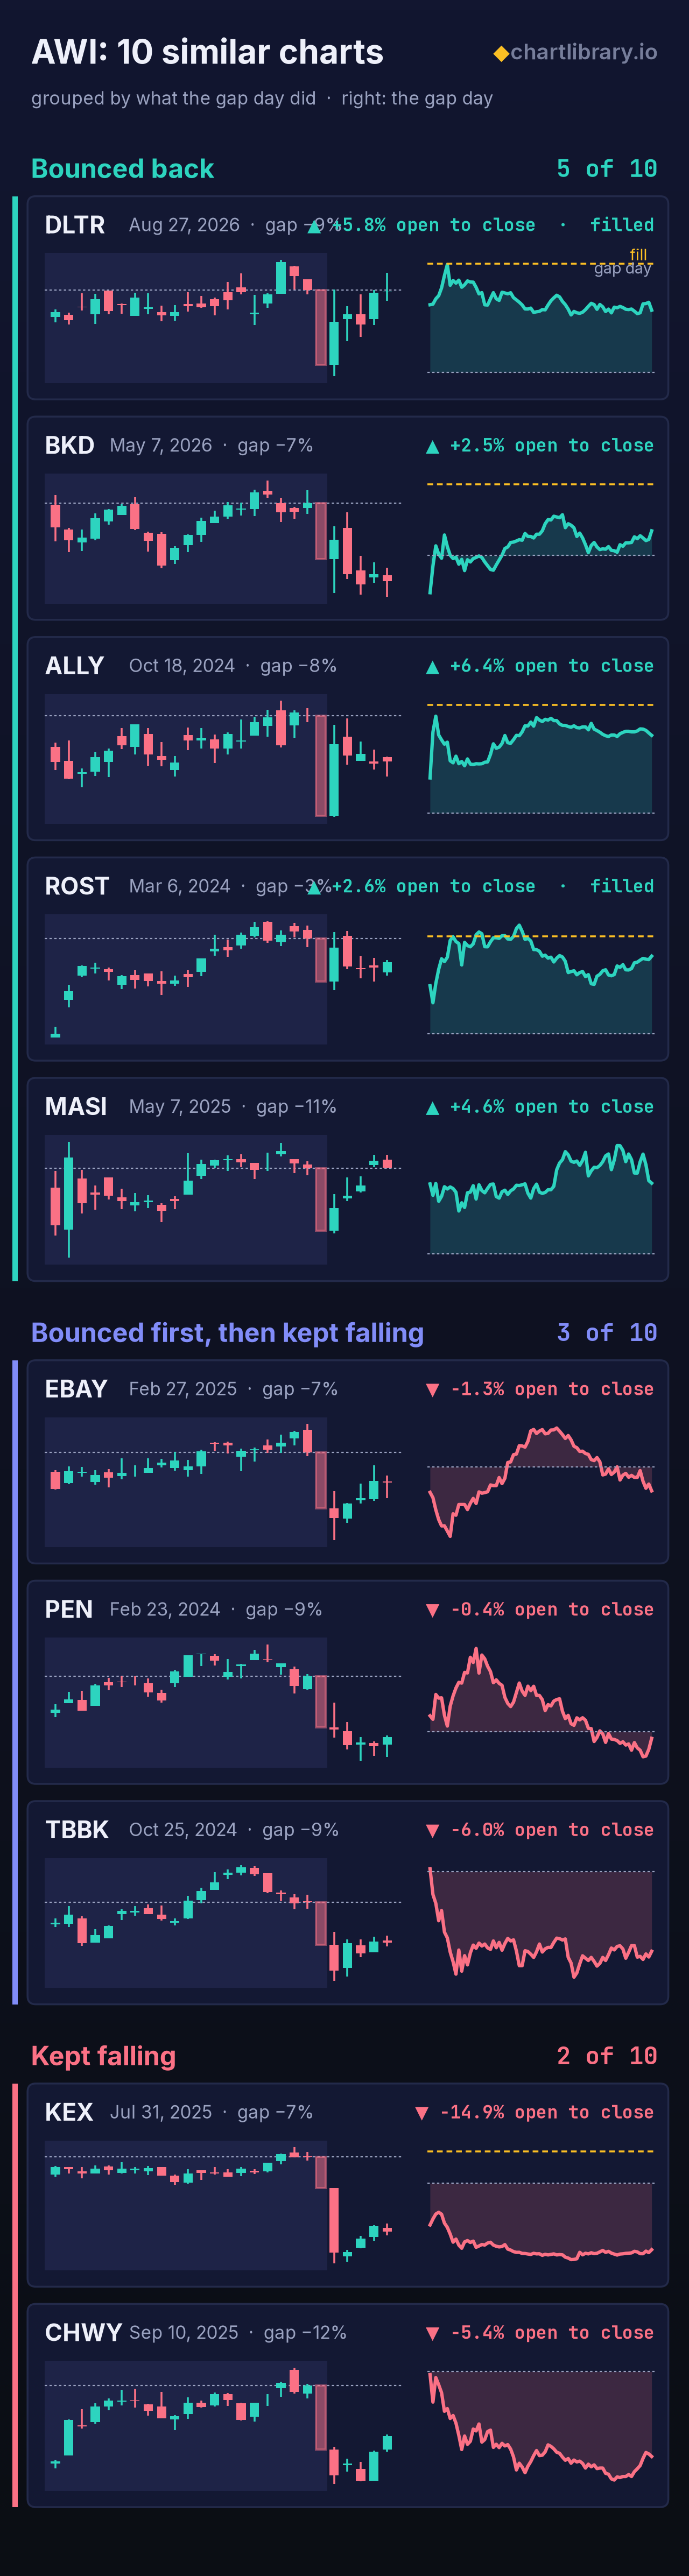
- Past gaps like this: Of the 10 most similar charts: 5 bounced back; 3 bounced first, then kept falling; 2 kept falling. Across all 552 similar gaps, about 1 in 11 filled the gap the same day.
What's new today
For Q3 2026 the company reported revenue of $475.8 million against a consensus of $472.6 million. Against Q3 2025 revenue of $425.2 million, that is growth of about 11.9%, in line with Q2's 11.2% and faster than the 5.6% and 7.1% of the two prior quarters. Adjusted EPS was $2.26 against a consensus of $2.39. For full-year 2026, the adjusted EPS range was narrowed to $8.30-$8.40 from $8.30-$8.50, below the $8.43 consensus, and the GAAP EPS range was lowered to $7.89-$7.99 from $7.99-$8.14. The sales range was raised to $1.788-$1.803 billion from $1.770-$1.800 billion, close to the $1.787 billion consensus. The stock's day-of-report moves over the last eight reports were five up and three down, from +9.4% to -9.6%.
The company
Armstrong World Industries makes ceilings, specialty walls and exterior metal products for commercial buildings in the United States and Canada. Its Mineral Fiber segment sells suspended mineral fiber and fiberglass ceiling systems and includes results from the Worthington Armstrong Venture (WAVE), which makes ceiling suspension grid. Its Architectural Specialties segment sells custom ceilings and walls, and its revenue is mainly project driven. The company has about 4,000 employees, trailing twelve-month revenue of $1.73 billion and a market value of about $7.0 billion.
The last eight quarters
Revenue growth ran 16-18% a year from Q4 2024 through Q2 2025, slowed to 5.6% in Q4 2025 and recovered to 11.2% in Q2 2026. Operating margin stayed between 22% and 29% and followed a seasonal pattern: the lows were Q4 2024 (22.3%), Q4 2025 (23.7%) and Q1 2026 (23.0%), and the highs came in Q2 and Q3. In Q2 2026 it was 28.3%, against 29.0% a year earlier. Diluted EPS in Q2 2026 was $2.26, up from $2.01 in Q2 2025. Operating cash flow was positive in all eight quarters, from $32.1 million in Q1 2026 to $122.9 million in Q3 2025.
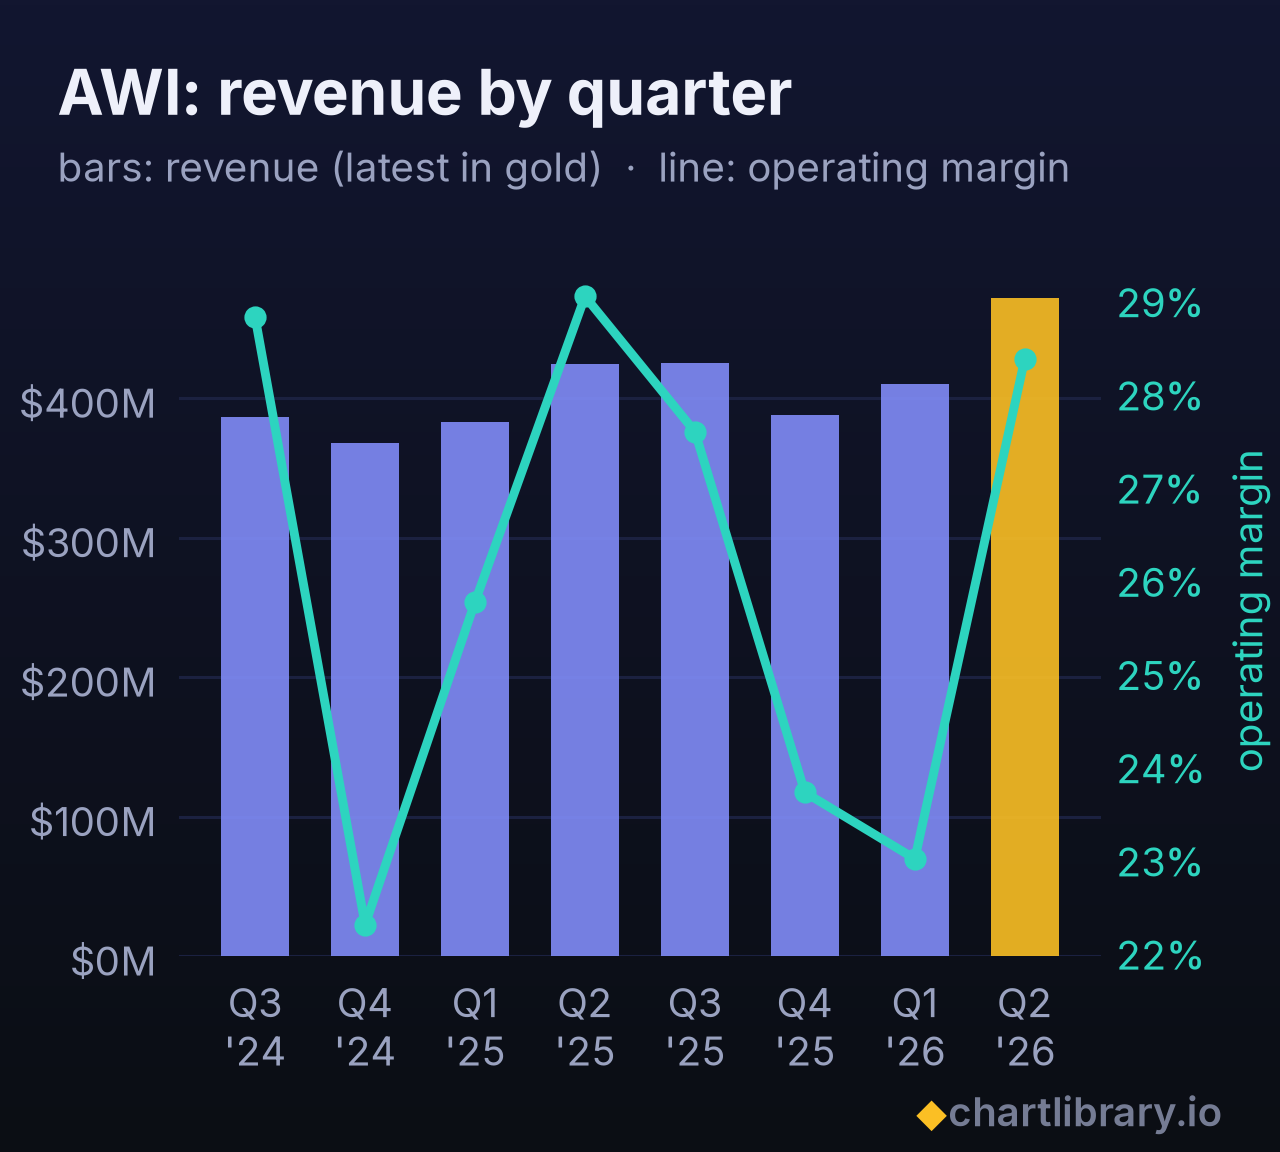
| Quarter | Revenue | vs a year ago | Gross margin | Op. margin | EPS | Op. cash flow |
|---|---|---|---|---|---|---|
| Q2 2026 | $472M | +11.2% | 41.3% | 28.3% | 2.26 | $94M |
| Q1 2026 | $410M | +7.1% | 37.9% | 23.0% | 1.55 | $32M |
| Q4 2025* | $388M | +5.6% | 39.8% | 23.7% | 1.51 | $110M |
| Q3 2025 | $425M | +10.0% | 42.0% | 27.6% | 1.98 | $123M |
| Q2 2025 | $425M | +16.3% | 41.4% | 29.0% | 2.01 | $82M |
| Q1 2025 | $383M | +17.3% | 39.2% | 25.7% | 1.58 | $41M |
| Q4 2024* | $368M | +17.7% | 39.1% | 22.3% | 1.41 | $87M |
| Q3 2024 | $387M | +11.3% | 42.4% | 28.8% | 1.75 | $96M |
From its filings, latest filed quarter first. *Q4 is the full year minus the first three quarters.
How it traded on its last reports
| Report | Opened | Open to close | Day |
|---|---|---|---|
| Jul 28, 2026 | +3.1% | +4.9% | +8.1% |
| Apr 28, 2026 | −5.4% | +1.0% | −4.5% |
| Feb 24, 2026 | −2.5% | −7.3% | −9.6% |
| Oct 28, 2025 | −2.3% | −2.2% | −4.5% |
| Jul 29, 2025 | +2.5% | +6.7% | +9.4% |
| Apr 29, 2025 | +1.3% | +3.3% | +4.6% |
| Feb 25, 2025 | +2.5% | +2.6% | +5.2% |
| Oct 29, 2024 | −0.9% | +2.9% | +2.0% |
The session that reacted: the report day or the next one, whichever gapped more (the calendar doesn't say before or after the bell).
What investors argue about
- Revenue beat while EPS missed: the revenue beat and the 11.9% year-over-year growth point to steady demand, while the $0.13 EPS shortfall raises the question of whether costs are holding back profit.
- Guidance reads two ways: the sales range was raised at both ends, but the top of the adjusted EPS range was cut and both EPS ranges now sit below consensus.
- Profitability against leverage: a 27.0% trailing operating margin and 19.5% net margin are high, while debt-to-equity of 1.27 and a P/E of 21.1 leave less room if growth slows, as it did to 5.6% in Q4 2025.
Numbers to know
- Q3 2026: revenue $475.8 million (consensus $472.6 million); adjusted EPS $2.26 (consensus $2.39).
- FY2026 guidance: adjusted EPS $8.30-$8.40 (consensus $8.43); GAAP EPS $7.89-$7.99; sales $1.788-$1.803 billion.
- Trailing twelve months: revenue $1.73 billion, up 11.2%; gross margin 40.7%; operating margin 27.0%; diluted EPS $7.80; P/E 21.1.
The 10 similar charts and the levels
The full detail
The news
· Tue 07:32 — Armstrong World Industries Reports Q3 2026 Financial Results
This is company-specific. Q3 was a revenue beat but an earnings miss, and the top of the FY adj. EPS range was cut, leaving the new range below the $8.43 Street estimate. FY GAAP EPS guidance was lowered to $7.89-$7.99 from $7.99-$8.14 vs $8.14 est. The sales guidance raise is small, with the new range around the $1.787B estimate. Broader markets are up 0.2-0.3% and peers are flat (median +0.1%), so the drop is not a sector or market move.
The last times like this
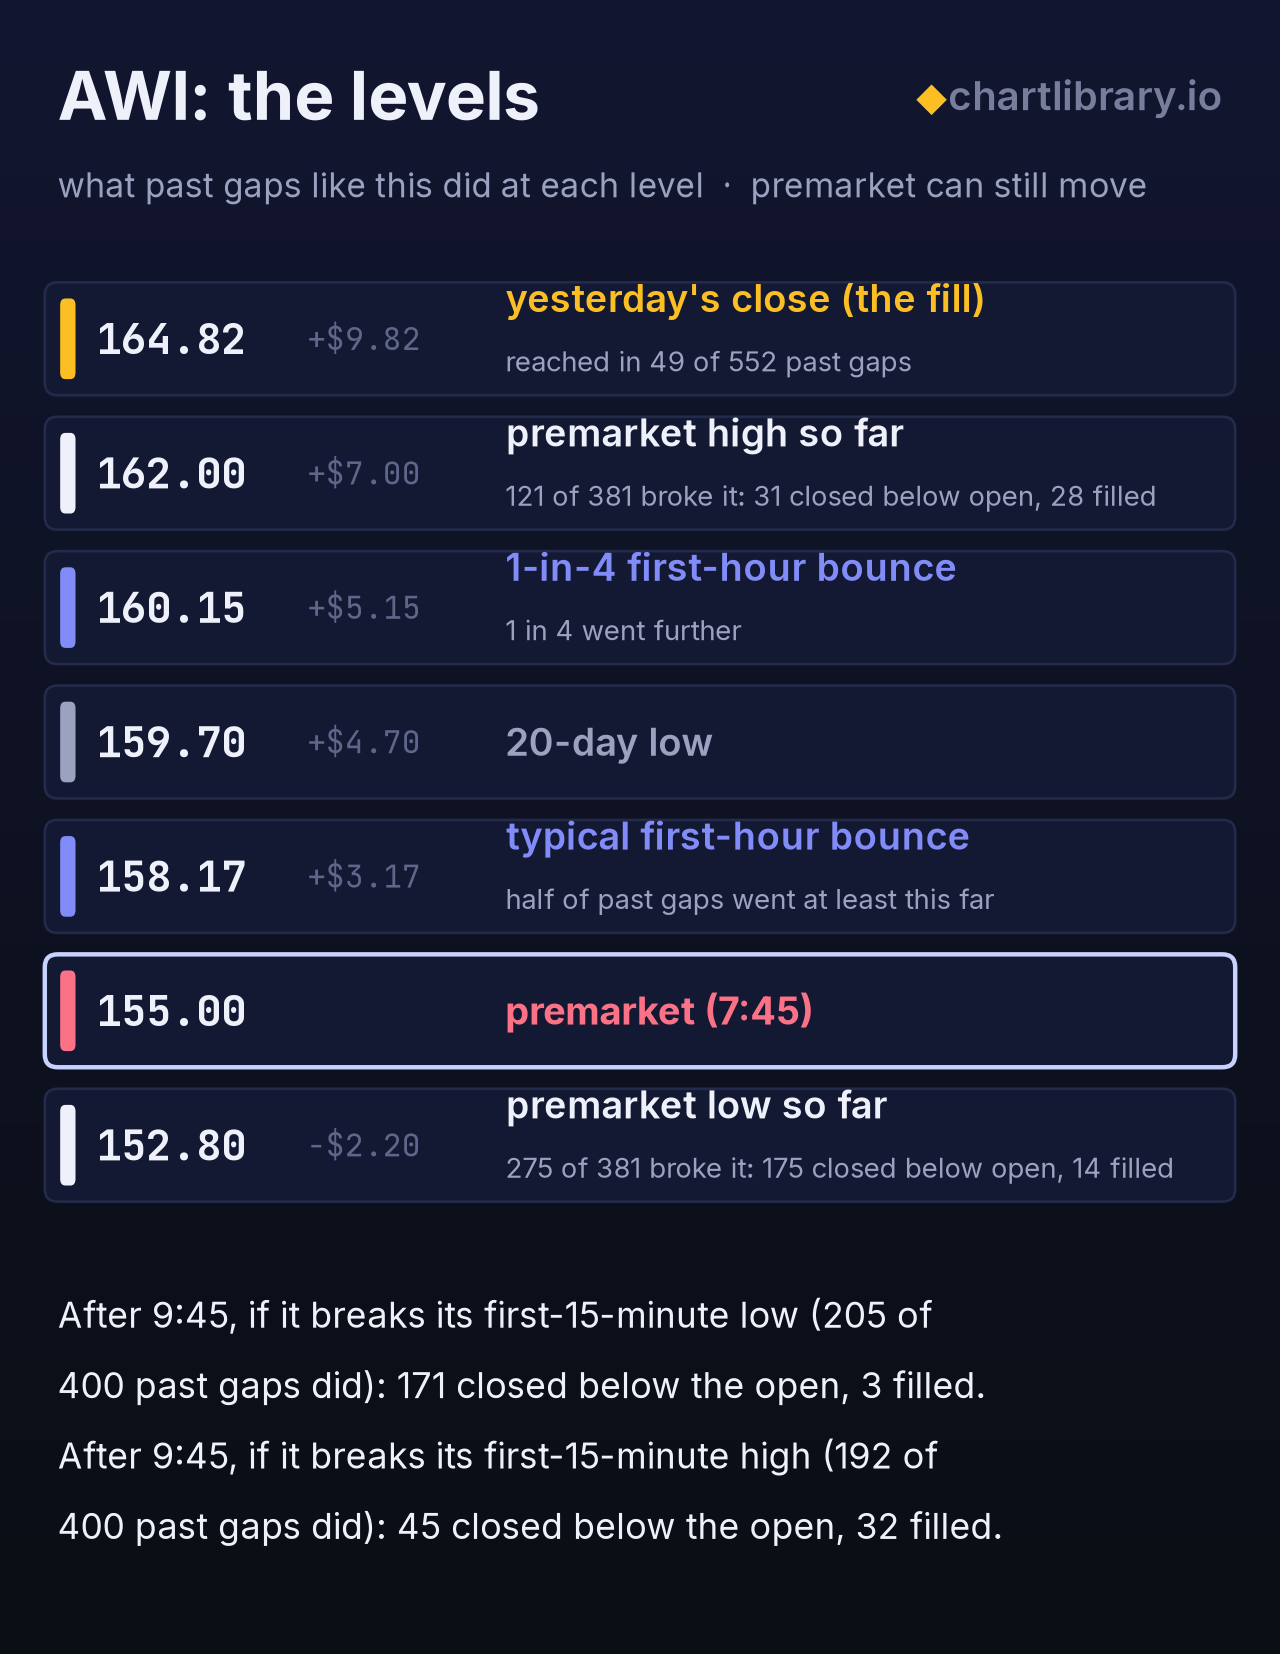
In 552 past earnings gaps down of this size on a morning the market also gapped up, 8 in 10 closes landed between $148.13 and $161.92 at today's price; yesterday's close, the fill, is $164.82.
AWI's own last 4 similar gaps: 3 came back toward the open without filling, 1 filled. The latest, Apr 28 '26, did not fill and closed a little above the open.
- If it trades above its premarket high so far ($162.00, as of 7:45): 121 of 381 past gaps like this did. Of those 121, 31 closed below the open and 28 went on to fill.
- If it breaks above its first-15-minute high after 9:45: 192 of 400 past gaps like this did. Of those 192, 45 closed below the open and 32 went on to fill.
- If it breaks below its first-15-minute low after 9:45: 205 of 400 past gaps like this did. Of those 205, 171 closed below the open and 3 went on to fill.
Mornings that looked like this one before the bell. Of the 10 closest premarket look-alikes, 4 sold off at the open, then climbed back; 3 popped at the open, then sold off; 2 pushed up at the open and held it; the other one went its own way. None filled the gap.
The next week or two (the 548 most recent similar gaps). Five sessions later they were above the gap-day open about 5 in 10 times; the middle one closed near $154.46 at today's price, with most between $149.65 and $159.88. Ten sessions later, about 5 in 10 were above the gap-day open. Within the week, about 5 in 10 traded through the gap day's high, and about 3 in 10 closed the fifth session beyond the gap day's low.
Levels
| Premarket (as of 7:45) | $155.00 (−6.0%) |
| Premarket high / low so far | $162.00 / $152.80 |
| Yesterday's close (the fill) | $164.82 |
| 20-day high / low | $173.39 / $159.70 |
Peers and options
Largest companies with its industry code:
| Premarket | Last 20 days | |
| ENTG | +1.3% | −6.9% |
| ATR | +0.1% | +2.1% |
| KRT | −0.1% | n/a |
| XLI (sector ETF) | +0.6% |
None of its peers trading premarket is moving with it: the move is AWI's own.
Numbers
| Premarket trading | heavy ($9.3M, 16% of a normal day) |
| A normal day for it | 2.0% (its 20-day average range) |
| Last 20 days | 0.0% |
What to watch
- Earnings call: no time given, check whether management explains the Q3 EPS miss and the cut to the top of the adj. EPS range.
The company
Armstrong makes mineral fiber and fiberglass ceiling systems and specialty architectural ceilings and walls for commercial buildings in the US and Canada. It also earns income from the Worthington Armstrong Venture (WAVE), which makes ceiling suspension grid. What its investors watch: Commercial renovation and project demand, especially Architectural Specialties.
Every weekday by about 8:10 ET: the three most talked-about gap stocks, each with its chart and the 10 most similar past charts, and a page like this on each.