← The October 23 morning issue
Ringcentral, Inc. (RNG)
1. RNG +15.2%earnings + guidance
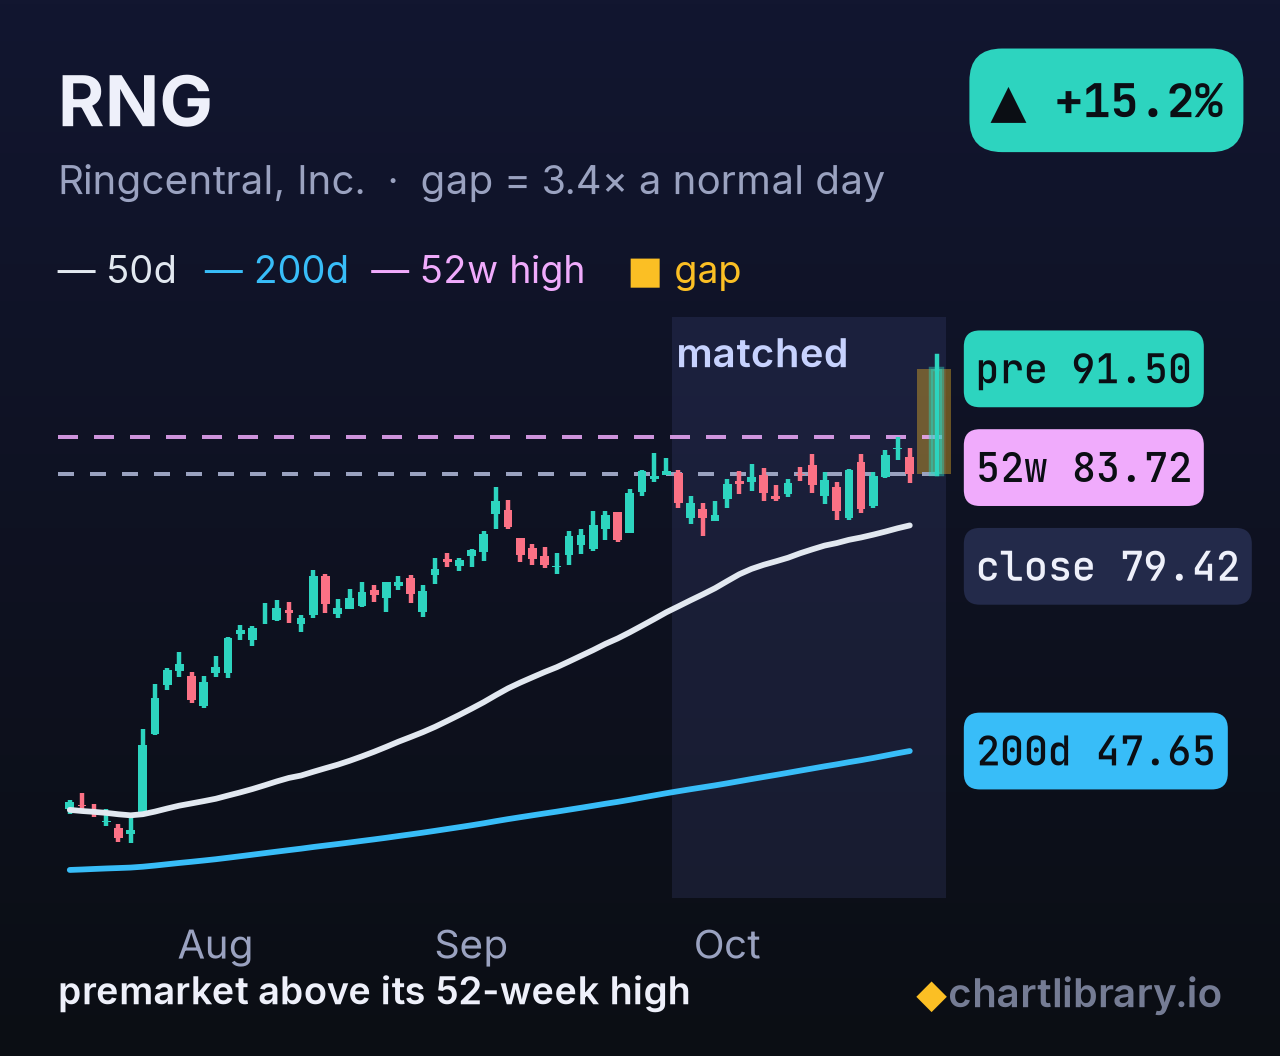
- Where it came from: Was at its 52-week high after a 56% run in three months; today's gap takes it to a new 52-week high.
- Today: Q3 adj. EPS $1.33 vs $1.28 est, revenue $676.043M vs $667.035M est; FY26 guidance raised to adj. EPS $5.07-$5.12 (vs $5.04 est) and sales $2.650B-$2.657B (vs $2.641B est).
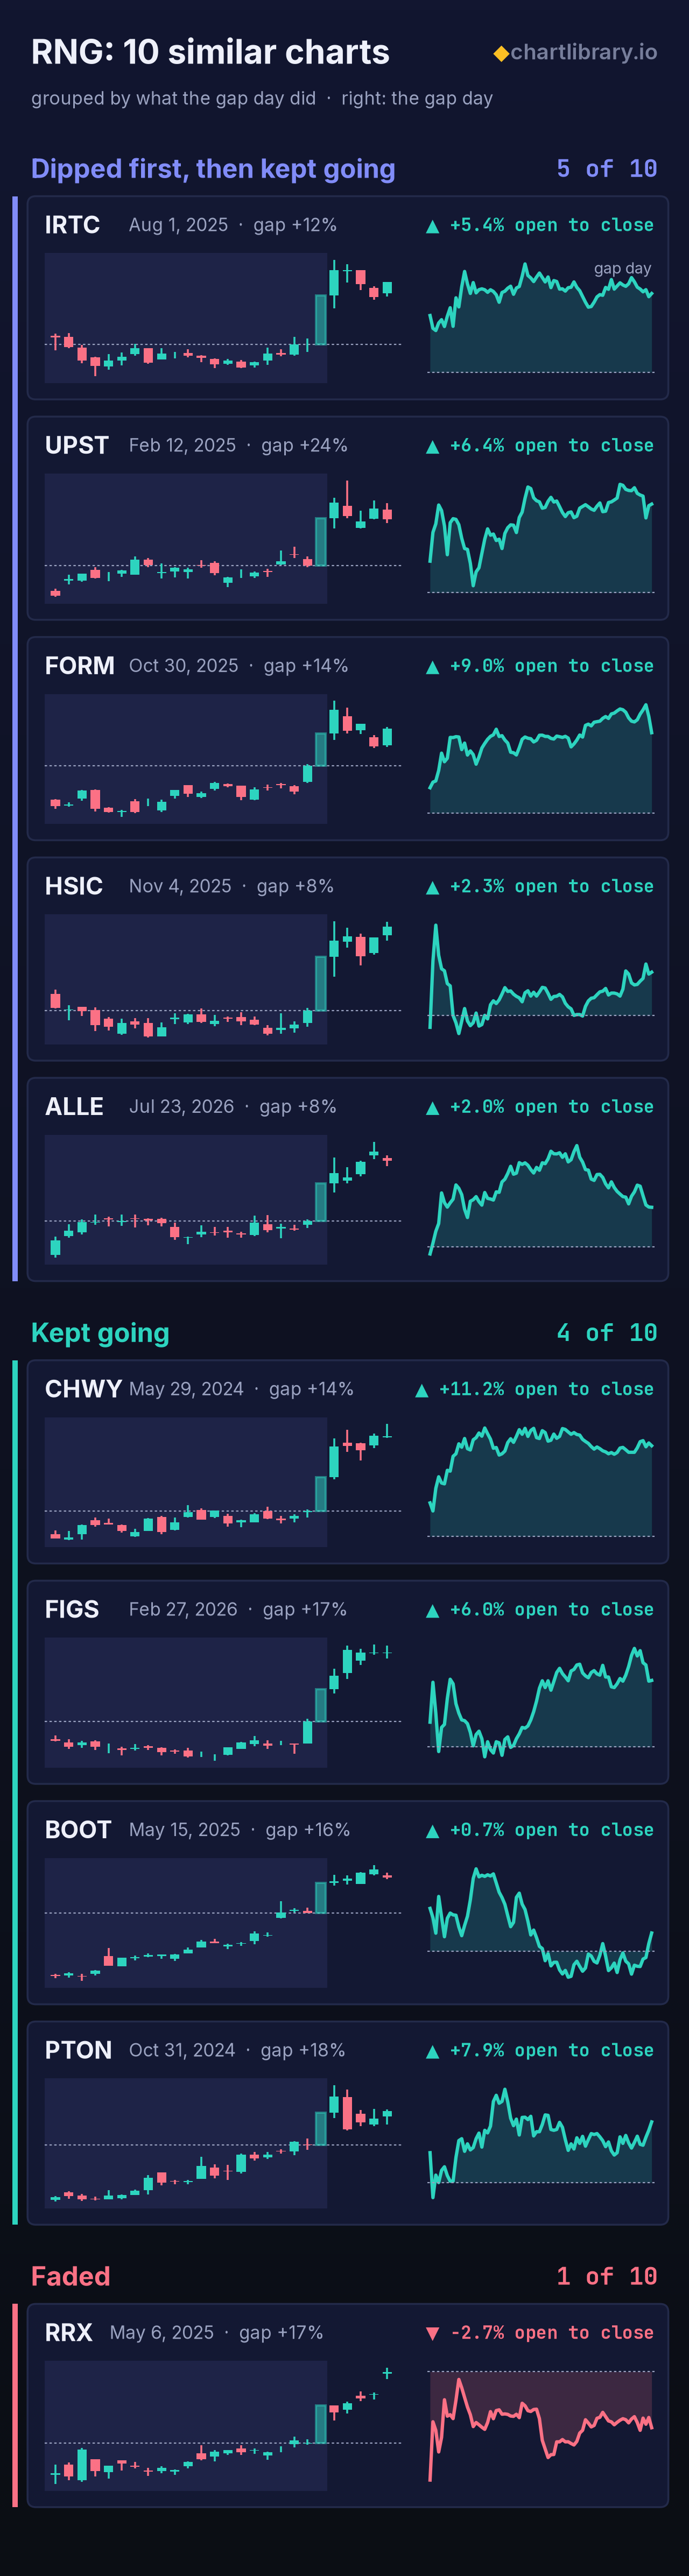
- Past gaps like this: Of the 10 most similar charts: 5 dipped first, then kept going; 4 kept going; 1 faded. Across all 218 similar gaps, about 1 in 9 filled the gap the same day.
What's new today
For Q3 2026, RingCentral reported adjusted EPS of $1.33 against a $1.28 estimate, and revenue of $676.043M against $667.035M. Revenue was about 5.9% above the $638.655M of Q3 2025, so growth held in the 5-6% range of recent quarters. The company raised its FY26 sales range to $2.650B-$2.657B from $2.635B-$2.646B, and its adjusted EPS range to $5.07-$5.12 from $4.96-$5.10. The Q4 outlook is close to estimates: adjusted EPS of $1.32-$1.37 against $1.35, and sales of $673M-$680M against $672.5M. So the full-year raise comes mostly from the Q3 beat. On the call, management cited record GAAP and non-GAAP operating margins, gross debt cut to under $1B ahead of schedule, non-GAAP EPS up 18% from a year earlier, and AI products at 15% of ARR. Needham raised its price objective to $110 and Morgan Stanley (Equal-Weight) to $91. A Golden State Warriors partnership expansion was also announced.
The company
RingCentral sells cloud-based communications software (UCaaS) that puts voice, video and messaging on one platform for businesses. Its core product is RingCentral MVP. It also sells a cloud contact center, stand-alone video meetings and webinars. It helps customers move off legacy on-premises phone systems, and it earns mostly subscription revenue. It has 7,378 employees, trailing twelve-month revenue of $2.56 billion and a market cap of about $7.0 billion.
The last eight quarters
Across the eight quarters shown, year-over-year revenue growth slowed from 9.5% in Q1 2024 and 9.1% in Q3 2024 to 4.8% in Q1 2025, then rose to 4.9%, 5.3% and 5.9% by Q2 2026. Quarterly revenue went from $584.2M in Q1 2024 to $657.0M in Q2 2026. Operating margin moved from -1.9% to 7.7% in Q1 2026 and 7.7% in Q2 2026, with a dip to 4.8% in Q3 2025 along the way. Gross margin edged up from 70.8% to 71.9%. Diluted EPS went from -$0.31 to $0.45, and operating cash flow from $96.1M to $206.4M.
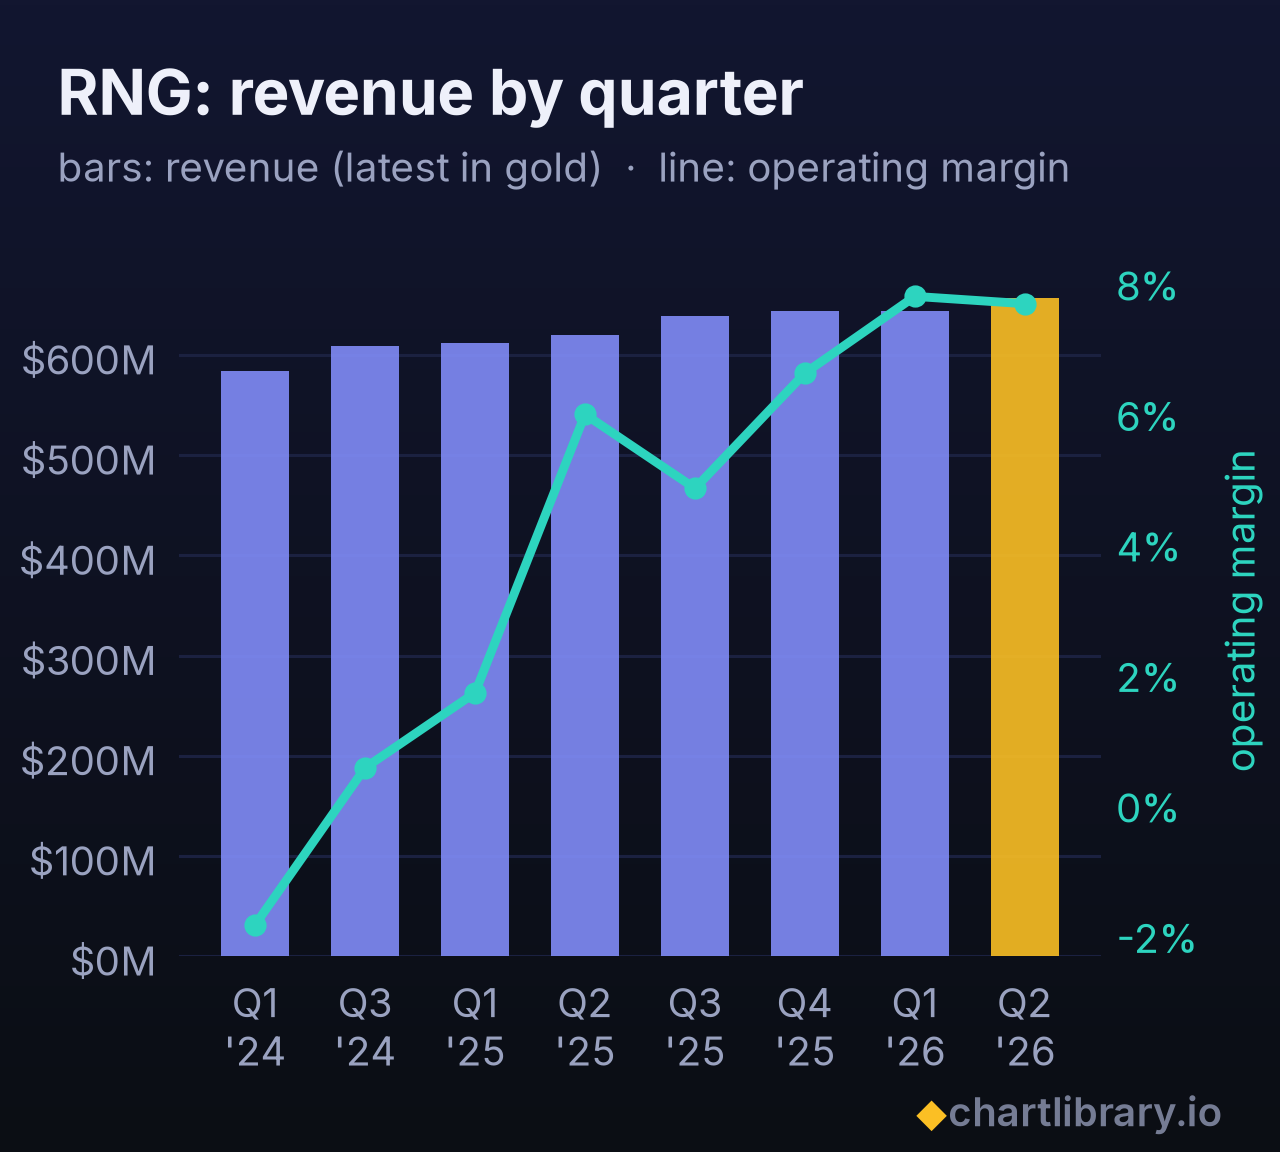
| Quarter | Revenue | vs a year ago | Gross margin | Op. margin | EPS | Op. cash flow |
|---|---|---|---|---|---|---|
| Q2 2026 | $657M | +5.9% | 71.9% | 7.7% | 0.45 | $206M |
| Q1 2026 | $644M | +5.3% | 72.1% | 7.8% | 0.35 | $164M |
| Q4 2025* | $644M | – | 71.5% | 6.6% | 0.26 | $149M |
| Q3 2025 | $639M | +4.9% | 71.8% | 4.8% | 0.19 | $151M |
| Q2 2025 | $620M | – | 71.2% | 6.0% | 0.14 | $167M |
| Q1 2025 | $612M | +4.8% | 70.5% | 1.7% | −0.11 | $150M |
| Q3 2024 | $609M | +9.1% | 70.4% | 0.5% | −0.09 | – |
| Q1 2024 | $584M | +9.5% | 70.8% | −1.9% | −0.31 | $96M |
From its filings, latest filed quarter first. *Q4 is the full year minus the first three quarters.
How it traded on its last reports
| Report | Opened | Open to close | Day |
|---|---|---|---|
| Jul 23, 2026 | +4.9% | +19.3% | +25.1% |
| May 7, 2026 | +2.5% | −3.2% | −0.7% |
| Feb 19, 2026 | +16.9% | +15.0% | +34.4% |
| Nov 3, 2025 | −6.3% | −2.1% | −8.2% |
| Aug 5, 2025 | +25.5% | +1.1% | +27.0% |
| May 8, 2025 | +1.2% | +1.0% | +2.2% |
| Feb 20, 2025 | −4.9% | −1.0% | −5.9% |
| Nov 7, 2024 | +1.1% | +2.3% | +3.5% |
The session that reacted: the report day or the next one, whichever gapped more (the calendar doesn't say before or after the bell).
What investors argue about
- Valuation: trailing GAAP EPS is $1.13 and the P/E is 70.3, which looks high. The company's own FY26 adjusted EPS range is $5.07-$5.12, a much larger number that excludes items the GAAP figure includes.
- Growth and AI: revenue growth has run at 4.8% to 5.9% for four quarters, below the 9% of early 2024. Management calls AI a powerful tailwind and says AI products are 15% of ARR, with its AI receptionist product up nearly 4x in customers. Whether that lifts overall growth is not yet visible in the quarterly numbers.
- Stock reactions: the stock has moved sharply after reports, up 25.1% on the day after the July 2026 report and 34.4% after the February 2026 report, but down 8.2% after the November 2025 report. Analysts differ too: Needham's $110 price objective sits well above Morgan Stanley's $91 with an Equal-Weight rating.
Numbers to know
- Q3 2026: revenue $676.043M vs $667.035M estimate; adjusted EPS $1.33 vs $1.28.
- FY26 guidance raised to sales of $2.650B-$2.657B and adjusted EPS of $5.07-$5.12; Q4 sales range $673M-$680M.
- Trailing twelve months: revenue $2.56B, up 5.9%; gross margin 71.7%; operating margin 6.6%; diluted EPS $1.13.
The 10 similar charts and the levels
The full detail
The news
· Thu 18:02 — RingCentral Reports Q3 2026 Financial Results
· Fri 07:32 — RingCentral Expands Partnership with Golden State Warriors
· Thu 18:10 — RingCentral Q3 2026 Earnings Call Transcript
This is a company-specific earnings beat with a guidance raise. The prior FY26 ranges were adj. EPS $4.96-$5.10 and sales $2.635B-$2.646B. The Q4 outlook is close to consensus: adj. EPS $1.32-$1.37 vs $1.35 est and sales $673M-$680M vs $672.5M est, so the raise to the full year comes mostly from the Q3 beat. On the call, management cited record GAAP and non-GAAP operating margins, gross debt cut to under $1B ahead of schedule, and AI products at 15% of ARR. Needham raised its target to $110 and Morgan Stanley (Equal-Weight) to $91. The Warriors partnership is minor. The broad market is down 0.3% to 0.7% premarket, so the move is not market-driven.
The last times like this
In 218 past earnings gaps up of this size on a morning the market also gapped down, 8 in 10 closes landed between $81.08 and $101.62 at today's price; yesterday's close, the fill, is $79.42.
RNG's own last 3 similar gaps: 2 kept going, 1 came back toward the open without filling, none filled. The latest, Feb 20 '26, did not fill and closed well above the open.
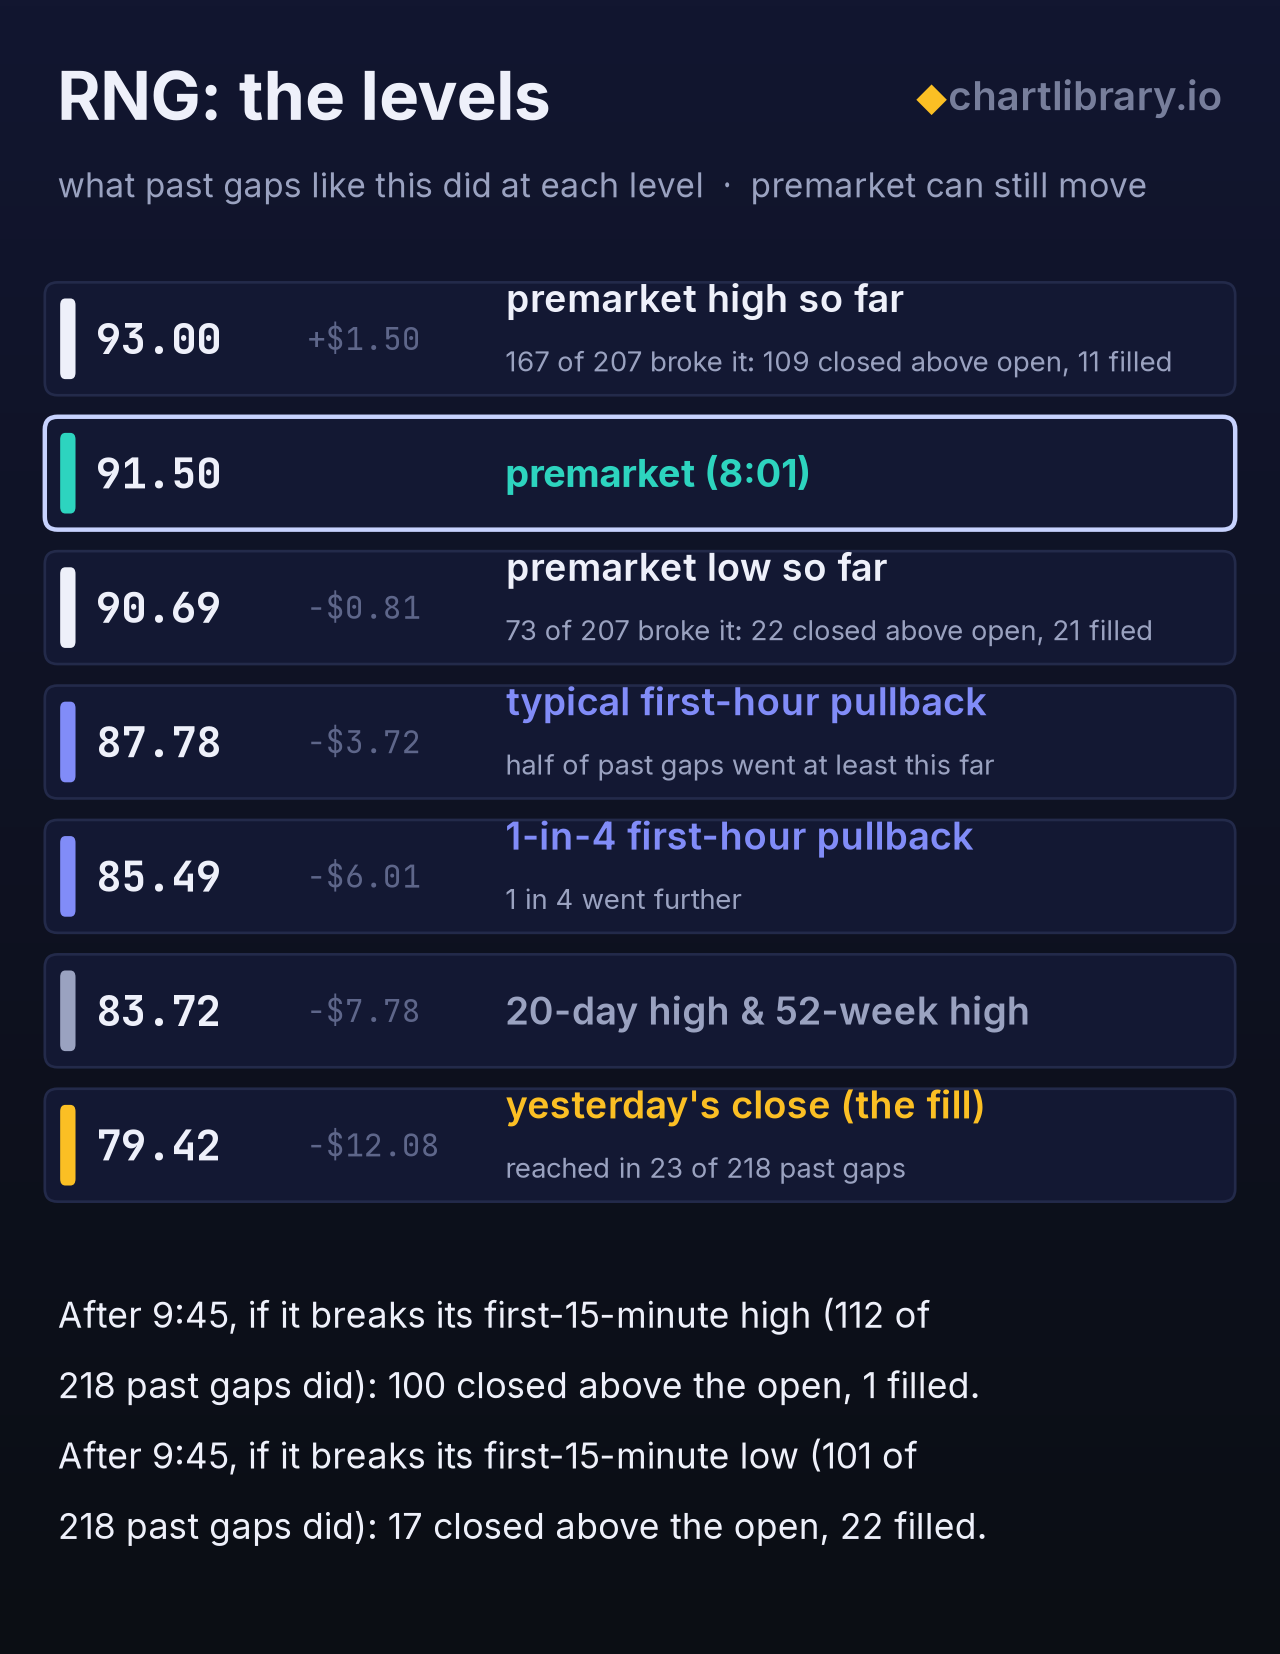
- If it trades below its premarket low so far ($90.69, as of 8:01): 73 of 207 past gaps like this did. Of those 73, 22 closed above the open and 21 went on to fill.
- If it breaks below its first-15-minute low after 9:45: 101 of 218 past gaps like this did. Of those 101, 17 closed above the open and 22 went on to fill.
- If it breaks above its first-15-minute high after 9:45: 112 of 218 past gaps like this did. Of those 112, 100 closed above the open and 1 went on to fill.
Mornings that looked like this one before the bell. Of the 10 closest premarket look-alikes, 3 sold off at the open, then climbed back; 2 slid from the open and kept going; 2 popped at the open, then sold off; the other 3 each went their own way. One filled the gap.
The next week or two (the 216 most recent similar gaps). Five sessions later they were above the gap-day open about 6 in 10 times; the middle one closed near $93.29 at today's price, with most between $85.98 and $100.67. Ten sessions later, about 6 in 10 were above the gap-day open. Within the week, about 5 in 10 traded through the gap day's low, and about 3 in 10 closed the fifth session beyond the gap day's high.
Levels
| Premarket (as of 8:01) | $91.50 (+15.2%) |
| Premarket high / low so far | $93.00 / $90.69 |
| Yesterday's close (the fill) | $79.42 |
| 20-day high / low | $83.72 / $72.29 |
| 52-week high | $83.72 |
Peers and options
Co-mentioned in the news:
| Premarket | Last 20 days | |
| FIVN | +2.3% | −4.3% |
| XLK (sector ETF) | −0.3% |
None of its peers trading premarket is moving with it: the move is RNG's own.
Options: at yesterday's close the $79 straddle expiring today priced a move of about ±11.0%. The premarket gap is +15.2%, 1.4× what options priced.
Numbers
| Premarket trading | thin ($2.4M, 2% of a normal day) |
| A normal day for it | 4.5% (its 20-day average range) |
| Short interest | 10% of float, 4.0 days to cover |
| Last 20 days | +9.5% |
What to watch
- Whether premarket strength holds after the open, given the Q4 guide is near consensus
- Other analyst target changes after Needham ($110) and Morgan Stanley ($91)
- FIVN, the one peer moving premarket, up 2.3%
The company
RingCentral sells cloud-based unified communications (voice, video, messaging) through its MVP platform, plus contact center and AI voice products, mainly on subscriptions. What its investors watch: Subscription revenue growth and AI product adoption (AI Receptionist, AI Conversation Expert) as a share of ARR; Operating margin expansion and free cash flow, which fund debt paydown and buybacks.
Every weekday by about 8:10 ET: the three most talked-about gap stocks, each with its chart and the 10 most similar past charts, and a page like this on each.